


More science with the same team
At Prima Mente, we develop biological artificial intelligence (BioAI) models to understand biology and the most difficult of diseases, starting with those of the brain. BioAI models improve as they see more molecular processes, more donors, and more cells. Much of this data is already published. What stands between a published experiment and a model-ready dataset is time-intensive and specialised work, and a critical limit on scale. We want the scope of our science to be set by the questions we ask, not by the time required to prepare the data to answer them.
Here we introduce Prima Daedalus, a multi-agent workflow that takes a published experiment through to an evaluated dataset, ready to train our biological models and to build the evaluation frameworks (or evals) that test them1,2,3. We apply Prima Daedalus to three published studies, each using an assay new to us. In every case, it recovered the authors' key findings, and in some it went further, surfacing events the original study had not reported, or improving published performance. Each dataset also yielded new evals, turning published science into direct tests of our models. Prima Daedalus did all of this in days rather than months, at a fraction of the cost of manual work.
Why data and evals onboarding limits BioAI
Biology is inherently multimodal: genome, epigenome, transcriptome, and proteome (and beyond) regulate one another to determine what each cell is and does. Many BioAI models learn from one main modality, such as transcription, chromatin accessibility, or DNA methylation4,5,6,7,8,9. Modern sequence-to-function models and single-cell foundation models increasingly combine these layers10,11,12,13,14, and virtual cell and world models of biology aim to unite them in a single modelling framework15,16. Each new layer, however, means the onboarding of a novel assay and requires us to learn its chemistry, build processing infrastructure, and translate methods into software. These choices determine whether there is a signal to be learned at all, and whether a model trained on the data learns biology or the quirks of a pipeline. Evals development raises the stakes even further, since a benchmark built on either poorly generated or wrongly processed data can be misleading when comparing models, and can reward a model for artefacts instead of biology17,18,19.
Our aim is to expand what any team can attempt with its existing expertise and resources, taking advantage of the rise of agentic workflows and the rapidly increasing rate of biological dataset generation. These solutions allow scientists to choose the questions, approve expenditure, and assess the evidence, while agents carry out the searches, implementation, execution, and comparisons that those decisions require. This approach builds on a growing body of scientific agent research. Earlier work includes Virtual Lab’s experimentally tested nanobody designs20, Biomni’s biomedical planning and code execution21, Google’s Co-Scientist for generating and reviewing hypotheses22, and ClawBio’s reusable bioinformatics skills23. Other very recent examples include Paper2Agent, which turns papers and code into tested, reusable tools24, Edison Scientific’s Robin, which combines hypothesis generation with experimental data analysis25, and Virtual Biotech, which coordinates agents for therapeutic research26.
However, most of these systems operate downstream of data curation, taking analysis-ready datasets as given. The upstream step, the work between a published experiment and an evaluated dataset for biological modelling and evals development, has been a recent focus for us. To the best of our knowledge, no end-to-end workflow is designed to onboard new technologies, fully pre- and postprocess biological datasets, and reproduce (or even improve on) a paper's findings, to ensure that the data are ready for modelling and evals development.
Prima Daedalus addresses this gap. In what follows, we present three case studies that allow us to interrogate splicing dysregulation in dementia, blood circulating transcripts in cancer, and quantitative measurements of chromatin accessibility. We describe the evals we derived from each, showing how the outputs translate directly into model development. Lastly, we demonstrate the time and cost savings Prima Daedalus delivers compared with manual and other AI-assisted approaches.
Prima Daedalus: from a paper to a fully evaluated dataset for modelling and evals
Prima Daedalus is our multi-agent workflow to build the data used to train and evaluate BioAI models. It relies on a model-agnostic AI coordinator guided by Markdown instructions, with code-enforced schema validation, across three main stages: (1) study interpretation and data acquisition, (2) pipeline matching and processing, and (3) scientific evaluation and promotion. All three stages are largely autonomous. However, to introduce some control and expenditure approval, we have introduced configurable human gates throughout a number of points.
Study interpretation and data acquisition | In this first stage, the paper-analyst interprets the assay, methods, and findings to reproduce; and the data-locator checks accessions, access and licensing restrictions, sample metadata, and author reference objects (Fig. 1b, stage 1). Together, they determine what can be reproduced before the acquisition gate allows raw data ingestion to cloud storage.
Pipeline matching and processing | Once the raw data are ingested, the pipeline-matcher selects existing internal processing paths, community pipelines, or bespoke development (Fig. 1b, stage 2; Fig. 1c). Where no suitable internal workflow exists, an onboarding agent configures an established community pipeline, such as those from the nf-core suite27, which are then orchestrated through Seqera Platform. When neither option covers what is needed, the pipeline-builder implements the missing steps or ports the authors' original workflow, implemented in Flyte and orchestrated through Union AI’s platform. Smoke tests use a subset of reads from one sample before full cohort execution. The optional aligner-evaluator compares methods on downsampled real samples, while a run-watchdog agent spans processing and analysis, diagnosing failures and stalls, and aborting dead runs.
Scientific evaluation and promotion | Third, the analysis-architect defines biological comparisons by turning the paper's findings into an explicit analysis plan. This plan specifies the required inputs, sample groups, methods, expected outputs, and author targets for comparison. The pipeline-builder implements and smoke-tests the plan before approved execution. Next, the author-concordance-verifier measures agreement, and the run-reporter records the evidence, verdict, and limits, making the methods, supporting evidence, remaining differences, and reproduction verdict available for scientific review (Fig. 1b, stage 3; Fig. 1d). For optional model inference, model-librarian checks model availability and input compatibility against an internal registry of both internal models and registered external models28, which when coupled with a model-eval agent, allows for inference by submitting GPU jobs to our Nebius cluster under a further compute gate. This then supplies the results to the same run-reporter described before.
Review and learning | Across all three stages, two additional agents are cross-cutting. First, a specialist independent stage-reviewer challenges decisions against source evidence, acting as an adversarial agent to reduce mistakes. Second, a learning agent keeps the design documents up to date, ensuring continuous learning and self-improvement (Fig. 1e). This last agent works alongside the workflow's built-in shared records, which improve reproducibility by retaining decisions, rationale, reviews, and resolutions for reuse. Lastly, after human expert evaluation of the outputs, a gate for dataset and workflow promotion unlocks the data for a centralised corpus.
In summary, Prima Daedalus supports automating the regular workflow a scientist would perform, with all the systematic checks expected in a human team.
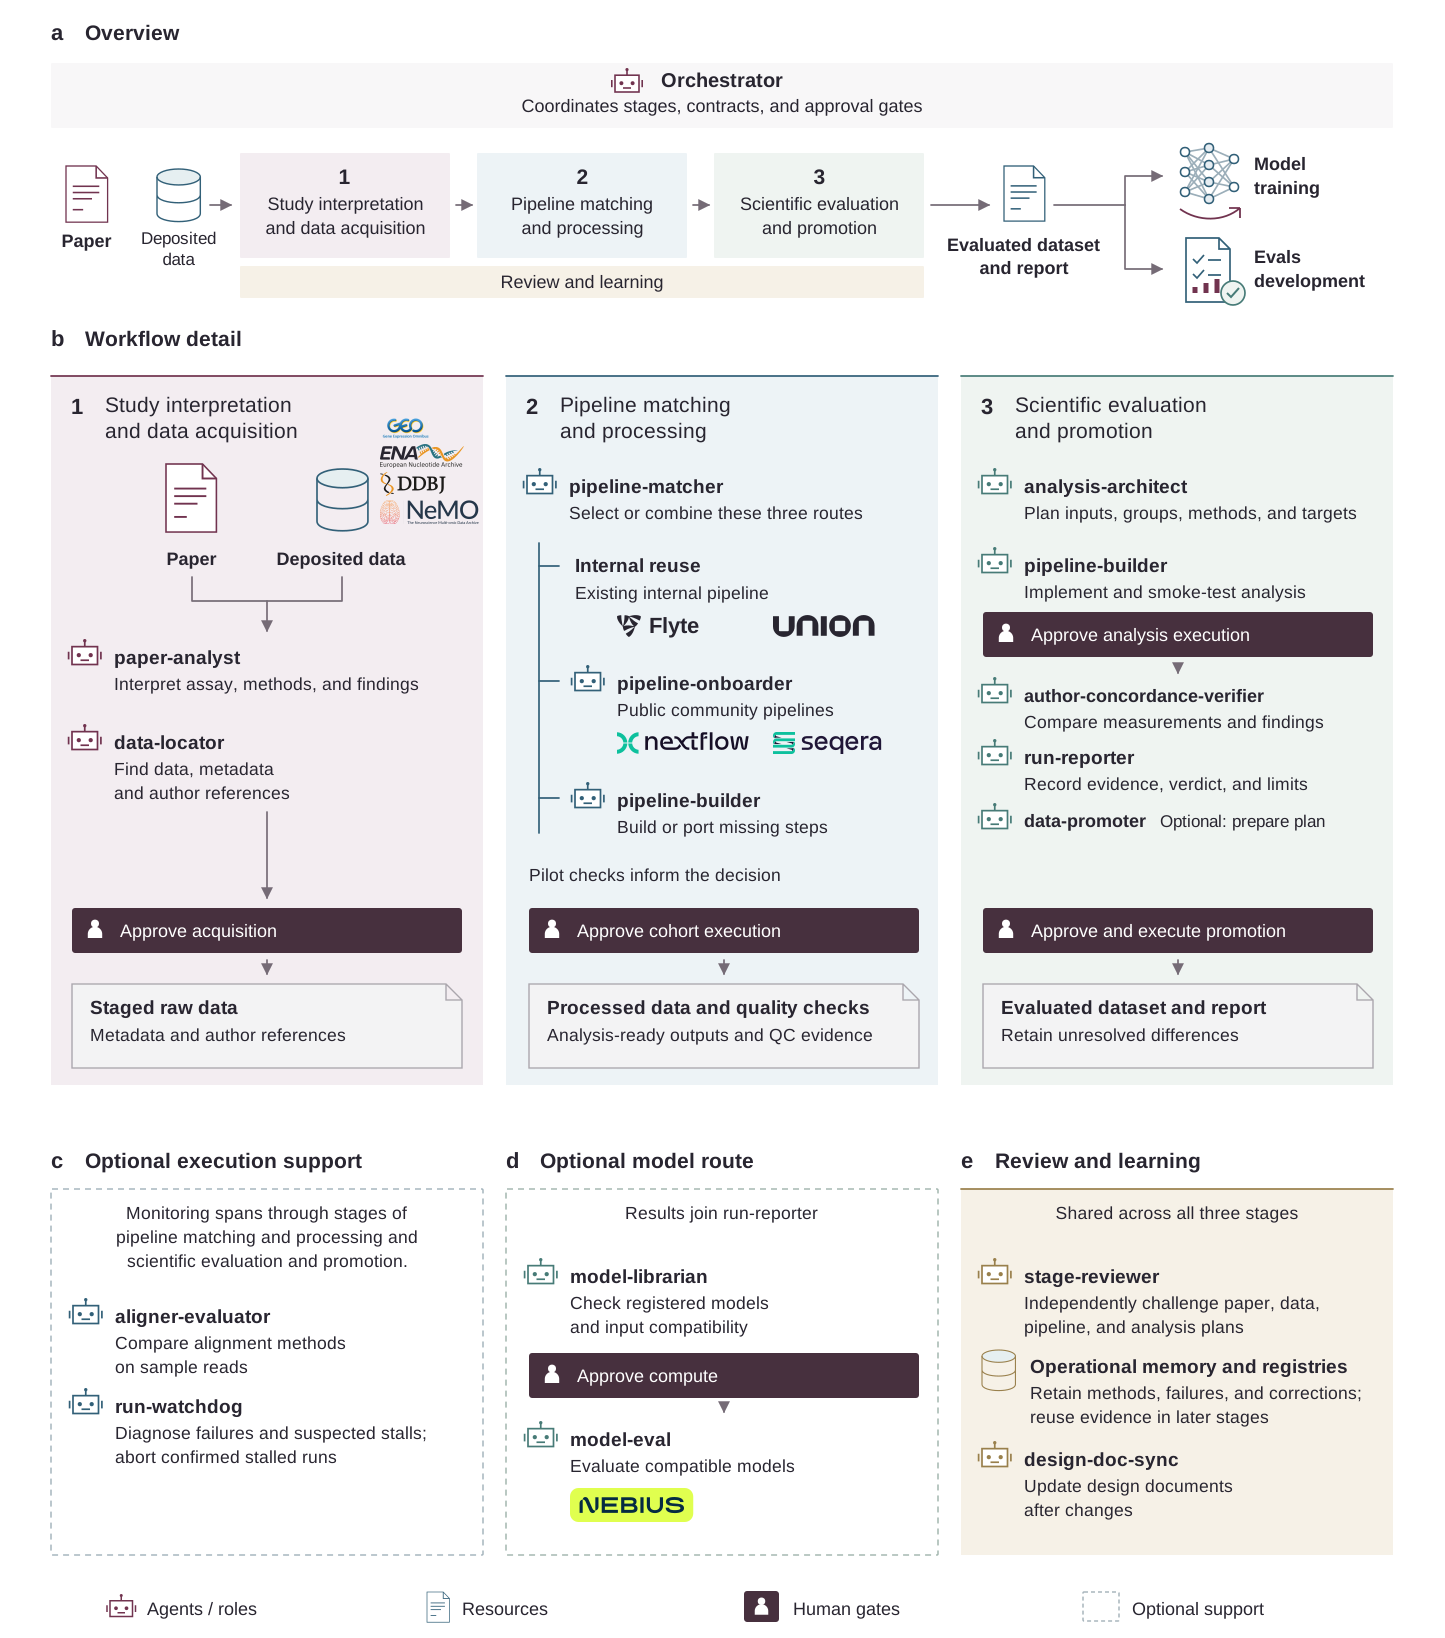
Figure 1. Scientific decisions and responsibilities in the Prima Daedalus workflow.
a, Overview. An orchestrator coordinates three stages that turn a paper and deposited data into an evaluated dataset and report for model training and evals development. b, Workflow detail. Stage 1, study interpretation and data acquisition, identifies methods, data, and author references before acquisition approval. Stage 2, pipeline matching and processing, combines internal reuse, public community pipelines through pipeline-onboarder, and bespoke development. Pilot checks inform cohort execution approval. Stage 3, scientific evaluation and promotion, plans and implements analyses, compares findings with author results, and records evidence and limitations. An optional data-promoter prepares a plan for human approval and promotion. Document shapes show each stage’s outputs. c, Optional execution support. The aligner-evaluator compares alignment methods; run-watchdog diagnoses failures and suspected stalls and aborts confirmed stalled runs. Monitoring spans processing and scientific evaluation. d, Optional model route. The model-librarian checks registered models and input compatibility. A human compute gate precedes model-eval; results join run-reporter. e, Review and learning across all three stages. The stage-reviewer independently challenges plans. Operational memory and registries retain methods, failures, and corrections, while design-doc-sync updates design documents. Agent names appear in bold; dark boxes mark human gates, and dashed boxes mark optional support. The figure shows raw-data reproduction; adoption of author-provided processed data is also possible but not shown.
Case studies
Case study 1: Resolving isoforms in single-cell data to model neurodegeneration
At a glance | This case study shows Prima Daedalus's ability to onboard an unfamiliar assay and independently reproduce a paper’s terminal findings in the absence of author-provided processed data. In particular, we identify cell type-specific dysregulation of splicing in FTD, including previously missed genes like SLC12A2 and CHL1.
RNA processing produces different transcripts, or isoforms, from the same gene. In the central nervous system, isoform patterns vary across brain regions, development, and cell types29,30,31. Splicing disruption contributes to neurological disease both directly through mutations that alter splicing, as in familial frontotemporal dementia (FTD) caused by MAPT mutations32,33; and indirectly through pathological splicing changes in sporadic FTD, amyotrophic lateral sclerosis (ALS), Alzheimer’s disease (AD), and related conditions34,35,36,37,38.
In 2022, SnISOr-Seq was introduced as a long-read single-nucleus RNA-seq technology and showcased with healthy and diseased human brain tissue (Fig. 2a)39. Long-read sequencing technologies like SnISOr-Seq resolve exon combinations that gene totals and start- or end-biased libraries cannot distinguish. For us, this connects disease phenotypes to specific isoforms and cell types, informing feature selection for models and investigation of therapeutic mechanisms. We applied Prima Daedalus to Belchikov et al.’s (2025) SnISOr-Seq2 case-control study of FTD40 in order to onboard an unfamiliar long-read single-cell assay and recover its disease-associated splicing findings.
Our multi-agent workflow staged the raw reads from NIH SRA and selected and onboarded the nf-core/scnanoseq pipeline for processing41, and added cell annotation and exon-inclusion analysis. Across eight runs over three days, it managed execution and fixed early task terminations (Fig. 2b). The authors’ processed long-read objects were unavailable for comparison, but their matched short-read objects allowed an indirect check across samples. Cell counts assessed sample correspondence (Fig. 2c); barcode overlap, unique molecular identifier (UMI), and gene-count correlations showed high short-read agreement (Fig. 2d). Comparing our long- and short-read outputs revealed similar cell capture but different gene counts, consistent with their different enrichment and counting methods (Fig. 2e).
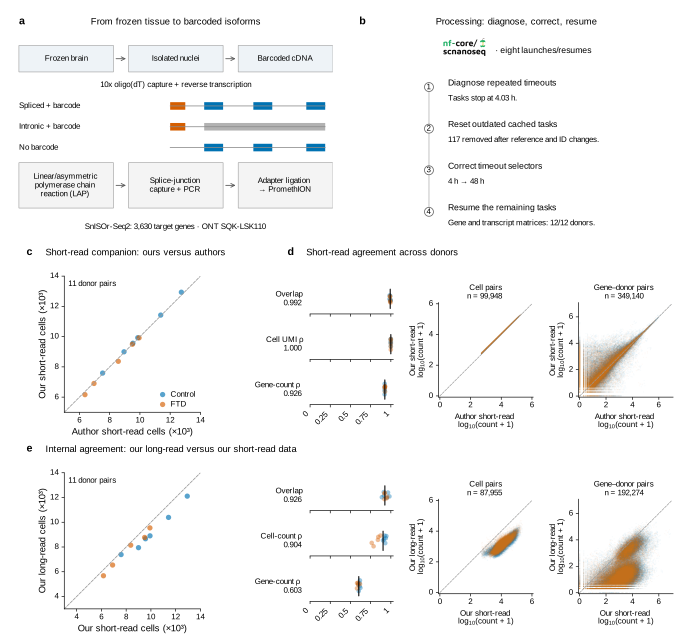
Figure 2. Reproducing SnISOr-Seq2 preprocessing and comparing sequencing methods.
a, Simplified SnISOr-Seq method, as described in Hardwick et al. (2022)39. 10x oligo(dT) capture and reverse transcription produce barcoded complementary DNA (cDNA). Linear/asymmetric polymerase chain reaction (LAP PCR) enriches barcoded molecules, producing long-read transcripts. Hybridisation capture and PCR precede Oxford Nanopore Technologies (ONT) adaptor ligation and PromethION sequencing. SnISOr-Seq2 uses a set of splice-junction probes targeting 3,630 genes40. ID, identifier; UMI, unique molecular identifier. b, Abridged run history: timeout diagnosis, cache reset, and timeout correction from 4 to 48 h, before gene/transcript matrices were produced for all 12 donors. c, Our short-read companion cell counts versus author-provided processed count matrices. d, Further short-read agreement with authors’ published objects. Dots show individual donors, black lines mark medians, square plots show every cell and gene–donor pair. Correlations use shared cells and gene correlations also use shared identifiers. e, Internal long-read versus short-read agreement, using the same comparisons. Our short-read outputs closely match the authors’ (d), and our long-read counts agree with our short-read counts where the methods overlap (e). All matched matrix barcodes have ≥ 1 total gene count. Long-read barcodes come from BLAZE42; FTD_2 lacks a confident match among available short-read samples and is excluded from paired comparisons. In c, d, and e, “ours” denotes Prima Daedalus automated processing, and log count stands for log10(count + 1). Long-read counts are deduplicated IsoQuant fractional assignments; short-read counts are individual Cell Ranger UMIs. Study: Belchikov et al. (2025)40. Raw reads were fetched from SRA (BioProjects PRJNA1238317 and PRJNA1053290). Author-provided data objects were fetched from GEO (GSE250280).
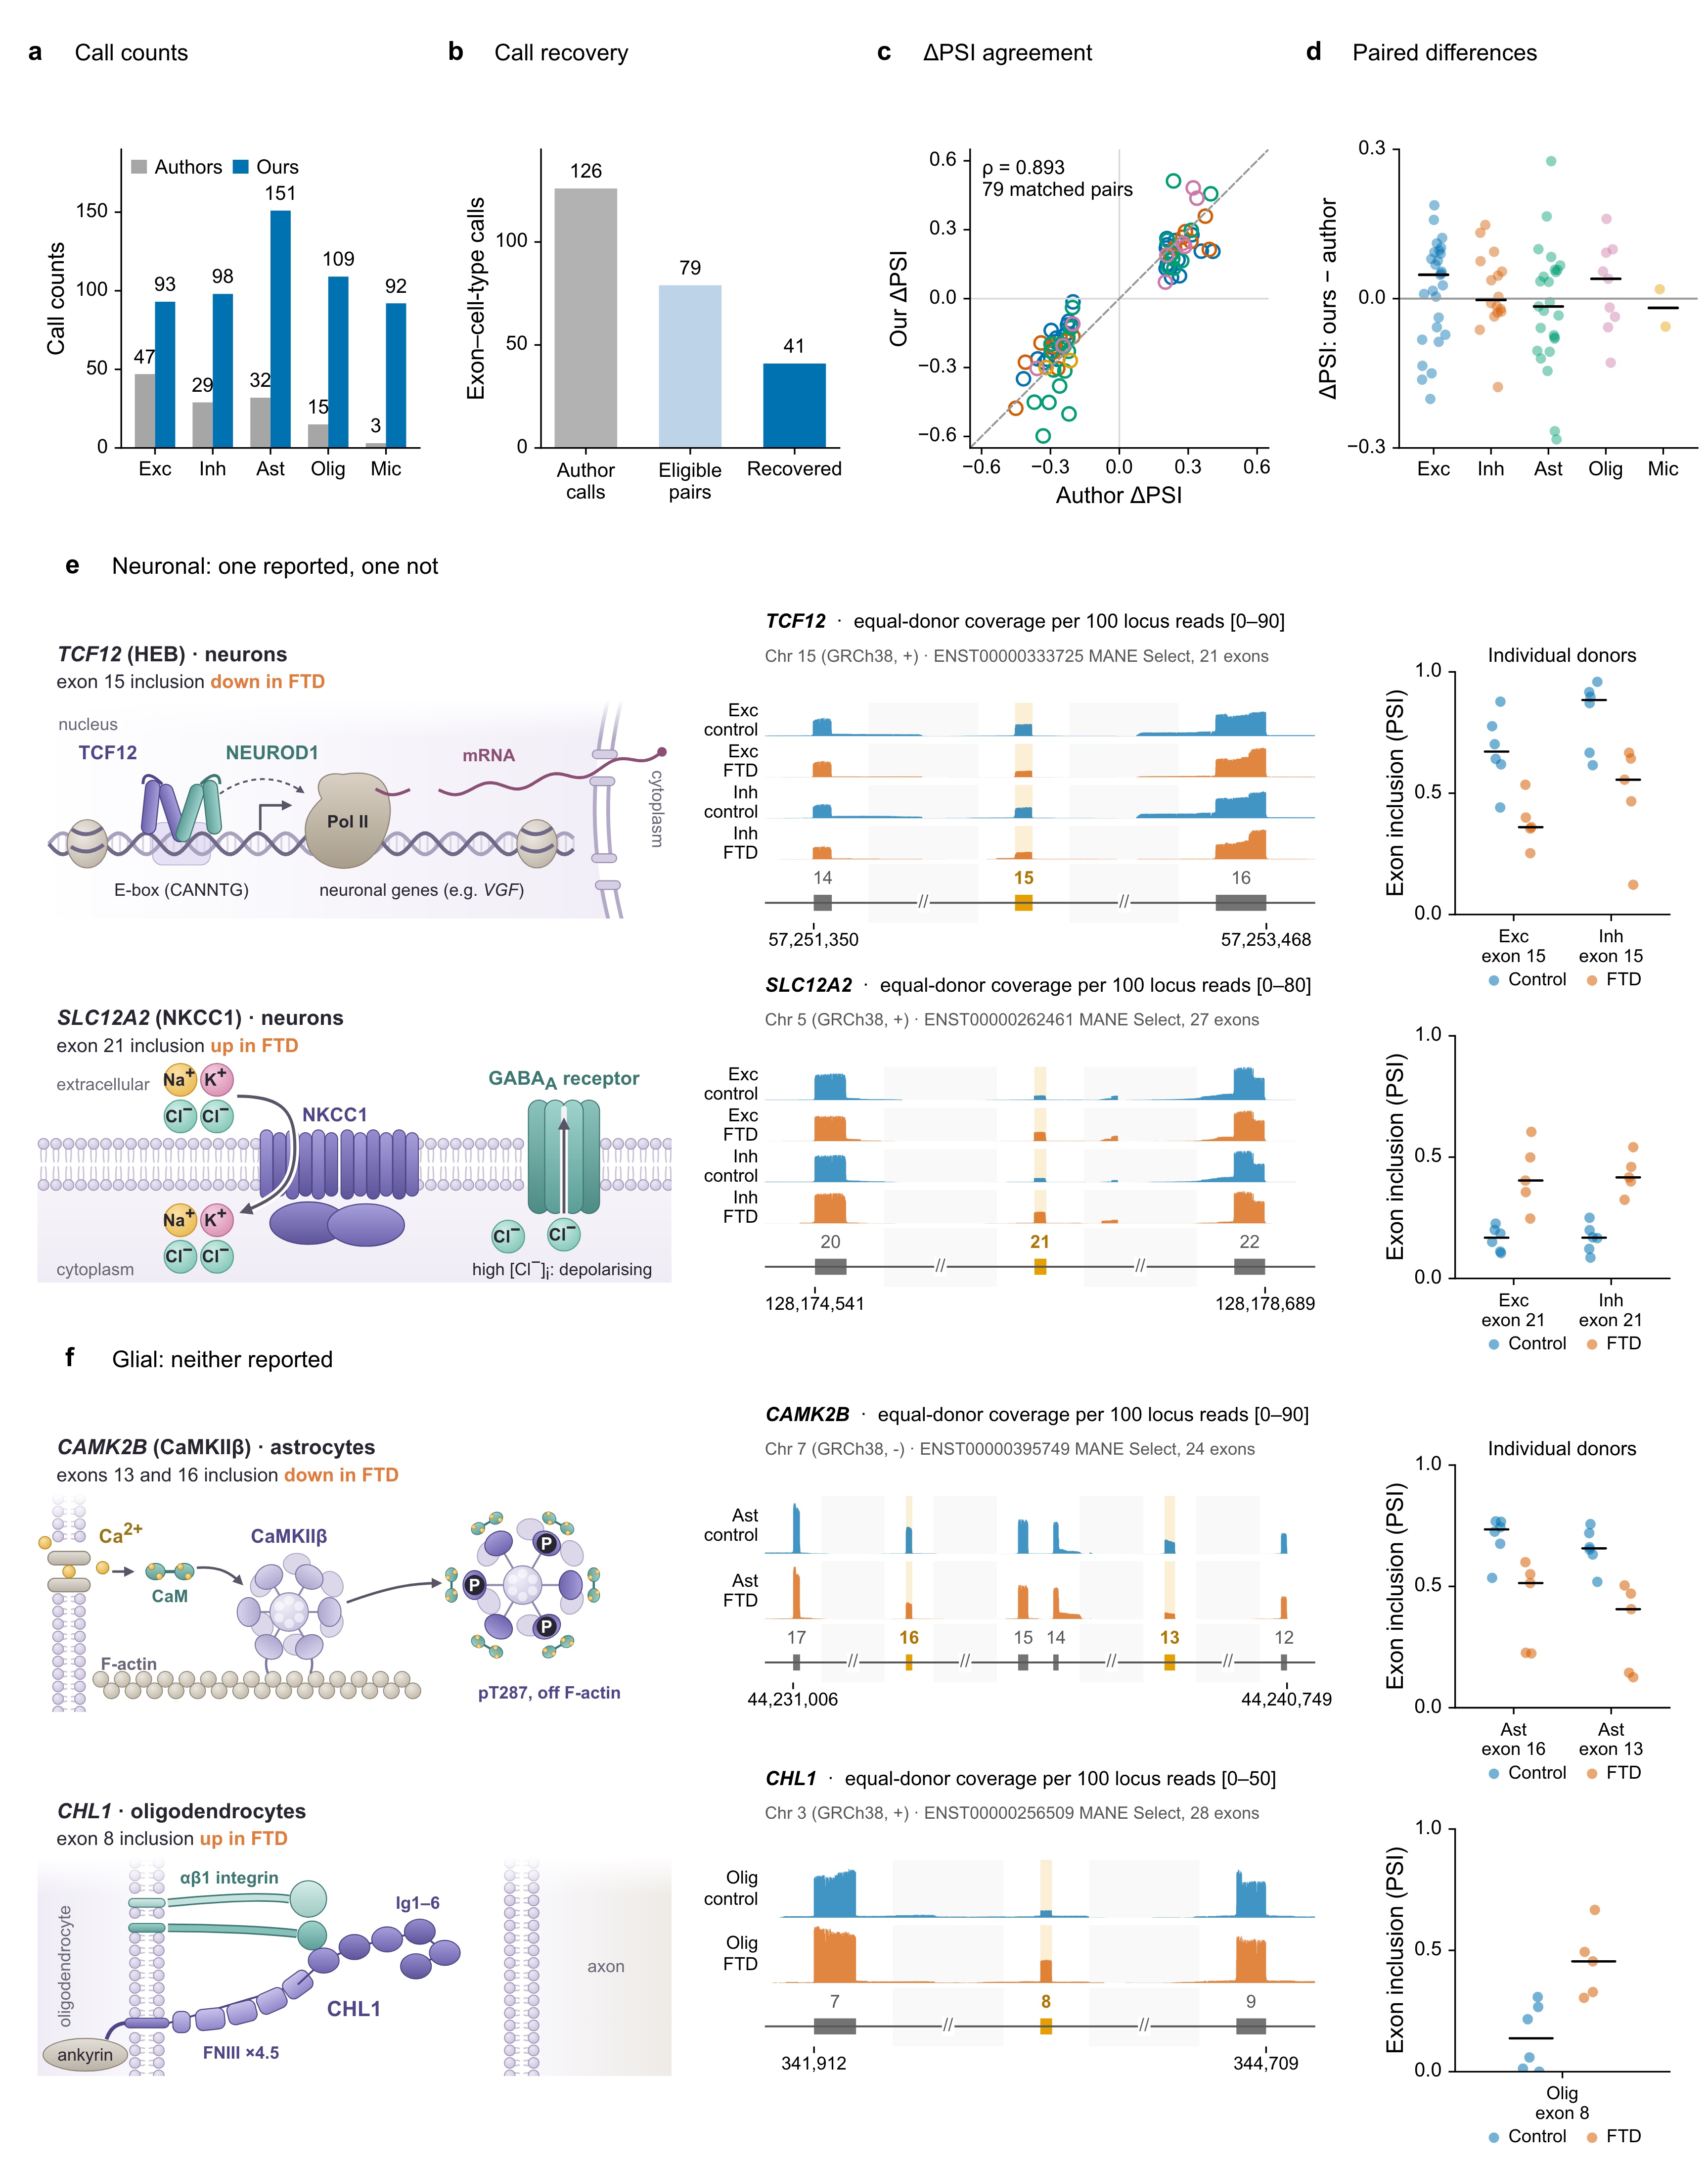
Beyond the reproduction of reprocessed objects, the most interesting aspect was for the agents to carry out a comparison of the disease effects that could be interrogated thanks to this novel technology. Our analysis called more differential exon usage events than the authors’ analysis (Fig. 3a, b). Of 126 author calls, 79 gene-matched exon–cell-type pairs qualify for comparison. Excitingly, all 79 that we recalled agree in direction of change upon disease, with very high correlation (Spearman rho = 0.893) and over half of those being statistically significant (Fig. 3c), and with the effect-size differences remaining without a consistent directional offset (Fig. 3d). Prima Daedalus independently recovered reduced exon inclusion in excitatory and inhibitory neurons for TCF12 (Fig. 3e), a key finding highlighted by Belchikov et al.40. Additionally, it also surfaced fourteen different events that the authors do not report. In the same neuronal populations, the SLC12A2 gene that encodes the Na-K-Cl cotransporter NKCC1, shown to be involved in neurodevelopmental disorders43, gains inclusion of exon 21 (Fig. 3e). In glia, CAMK2B, which is involved in neurocritical calcium metabolism44, and CHL1, involved in cell–cell adhesion45 and reported as a potential biomarker of FTD46, also undergo differential isoform usage in astrocytes and oligodendrocytes, respectively (Fig. 3f). None of these three (and eleven others) appears in the published call set, and their roles in neuronal and glial support upon FTD remain largely untested.
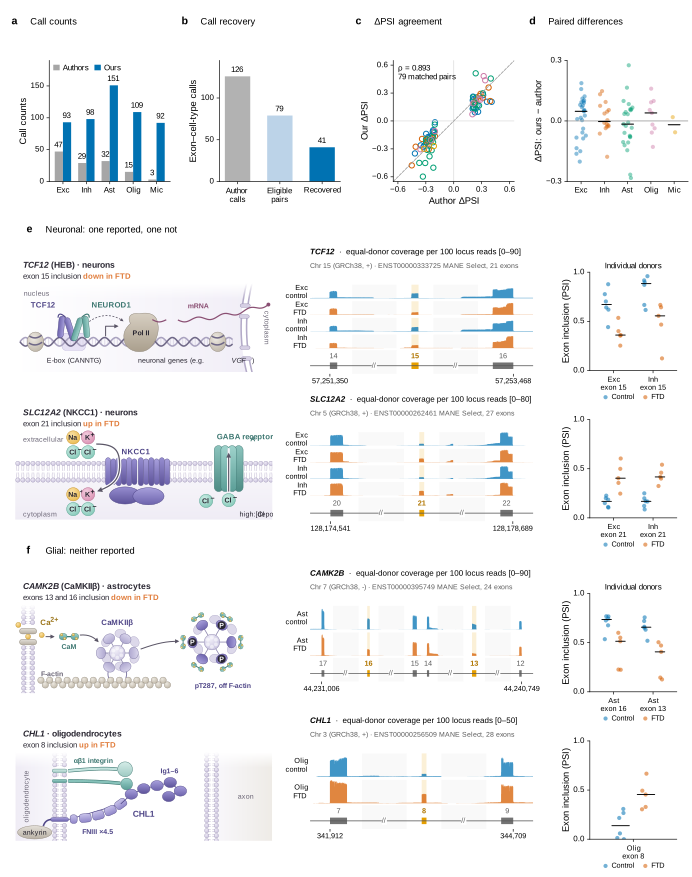
Figure 3. FTD-associated cell type-specific differential splicing in the human brain.
The percent spliced in (PSI) metric is frequently used to measure exon inclusion; ΔPSI is the case-minus-control difference, shown as a fraction. a, Significant differential exon usage calls by cell type: 126 author calls versus 543 of ours. Final calls require Benjamini–Yekutieli (BY)-adjusted P ≤ 0.05, |ΔPSI| ≥ 0.2, and the stored donor-consistency rule. Fisher tests pool reads without modelling donor dependence. b, We recovered as significant 41 (51.9%) of the 79 eligible pairs (62.7%), from the total of 126 published calls. c, Author-provided ΔPSI (FTD-minus-control inclusion fraction) versus ours for the 79 gene-matched exon–cell-type pairs across 66 different intervals. Spearman ρ = 0.893, with direction agreeing for 100% of the calls. Colours here identify cell types. d, Paired ΔPSI differences depicting the difference between ours and the author-provided ones. Black lines mark cell-type medians. e, Neuronal examples: reduced inclusion of TCF12 exon 15, reported by Belchikov et al., and increased inclusion of SLC12A2 exon 21, not reported in the paper or Table S2. Both are among the 26 of 543 significant exon–cell-type calls that pass coverage and donor-consistency checks. Left, schematic of each protein's place and role in the cell. Middle, equal-donor coverage above the MANE Select gene model, with tested exons in orange. Right, per-donor inclusion. f, Glial examples, neither reported: reduced inclusion of CAMK2B exons 13 and 16 in astrocytes and increased inclusion of CHL1 exon 8 in oligodendrocytes. Tracks use shared scales within each locus. Dots show donor PSI values; black lines mark medians. In c and d, “ours” denotes the final automated Prima Daedalus analysis. In e and f, exon numbers follow MANE Select transcripts. Coverage shows mean donor depth per 100 primary, mapped, cell-labelled reads; introns are compressed. Examples require ≥ 10 informative reads per donor, ≥ 24/30 directional case–control pairs, and consistent effects after each donor omission. Exc, excitatory neurons; Inh, inhibitory neurons; Ast, astrocytes; Olig, oligodendrocytes; Mic, microglia. Study: Belchikov et al. (2025)40. Author ΔPSI values and dysregulated-exon counts come from Belchikov et al., Table S2 (supplementary PDF, pp. 21–24). Counts represent exon–cell-type calls.
Case study 2: Onboarding cell-free RNA for model-driven multimodal diagnostics
At a glance | This case study shows Prima Daedalus's ability to configure pipelines around the biological question rather than the defaults, retaining non-human reads that standard settings would discard. Testing alternative analyses the authors hadn't explored, it improved the authors’ best performance at cancer-type recall by 3.4 percentage points.
At Prima Mente we have previously used BioAI foundation models for the early detection of neurodegeneration with liquid biopsies. The first version of our Pleiades model was applied to Alzheimer’s and Parkinson’s disease signals in cell-free DNA methylation libraries47,48. Plasma cell-free RNA (cfRNA) adds transcripts from multiple tissues and cell types49, with reported changes in Alzheimer’s disease50 as well as other diseases including cancer51, tuberculosis52, and pre-eclampsia53. Combining these two signals could support multimodal diagnostics.
We used Prima Daedalus with a two-fold aim: (1) to validate processing for our own cfRNA libraries by reproducing a published cohort end-to-end; and (2) to use that validated route to test additional novel analyses, which we hypothesised could lead to improved diagnostic performance.
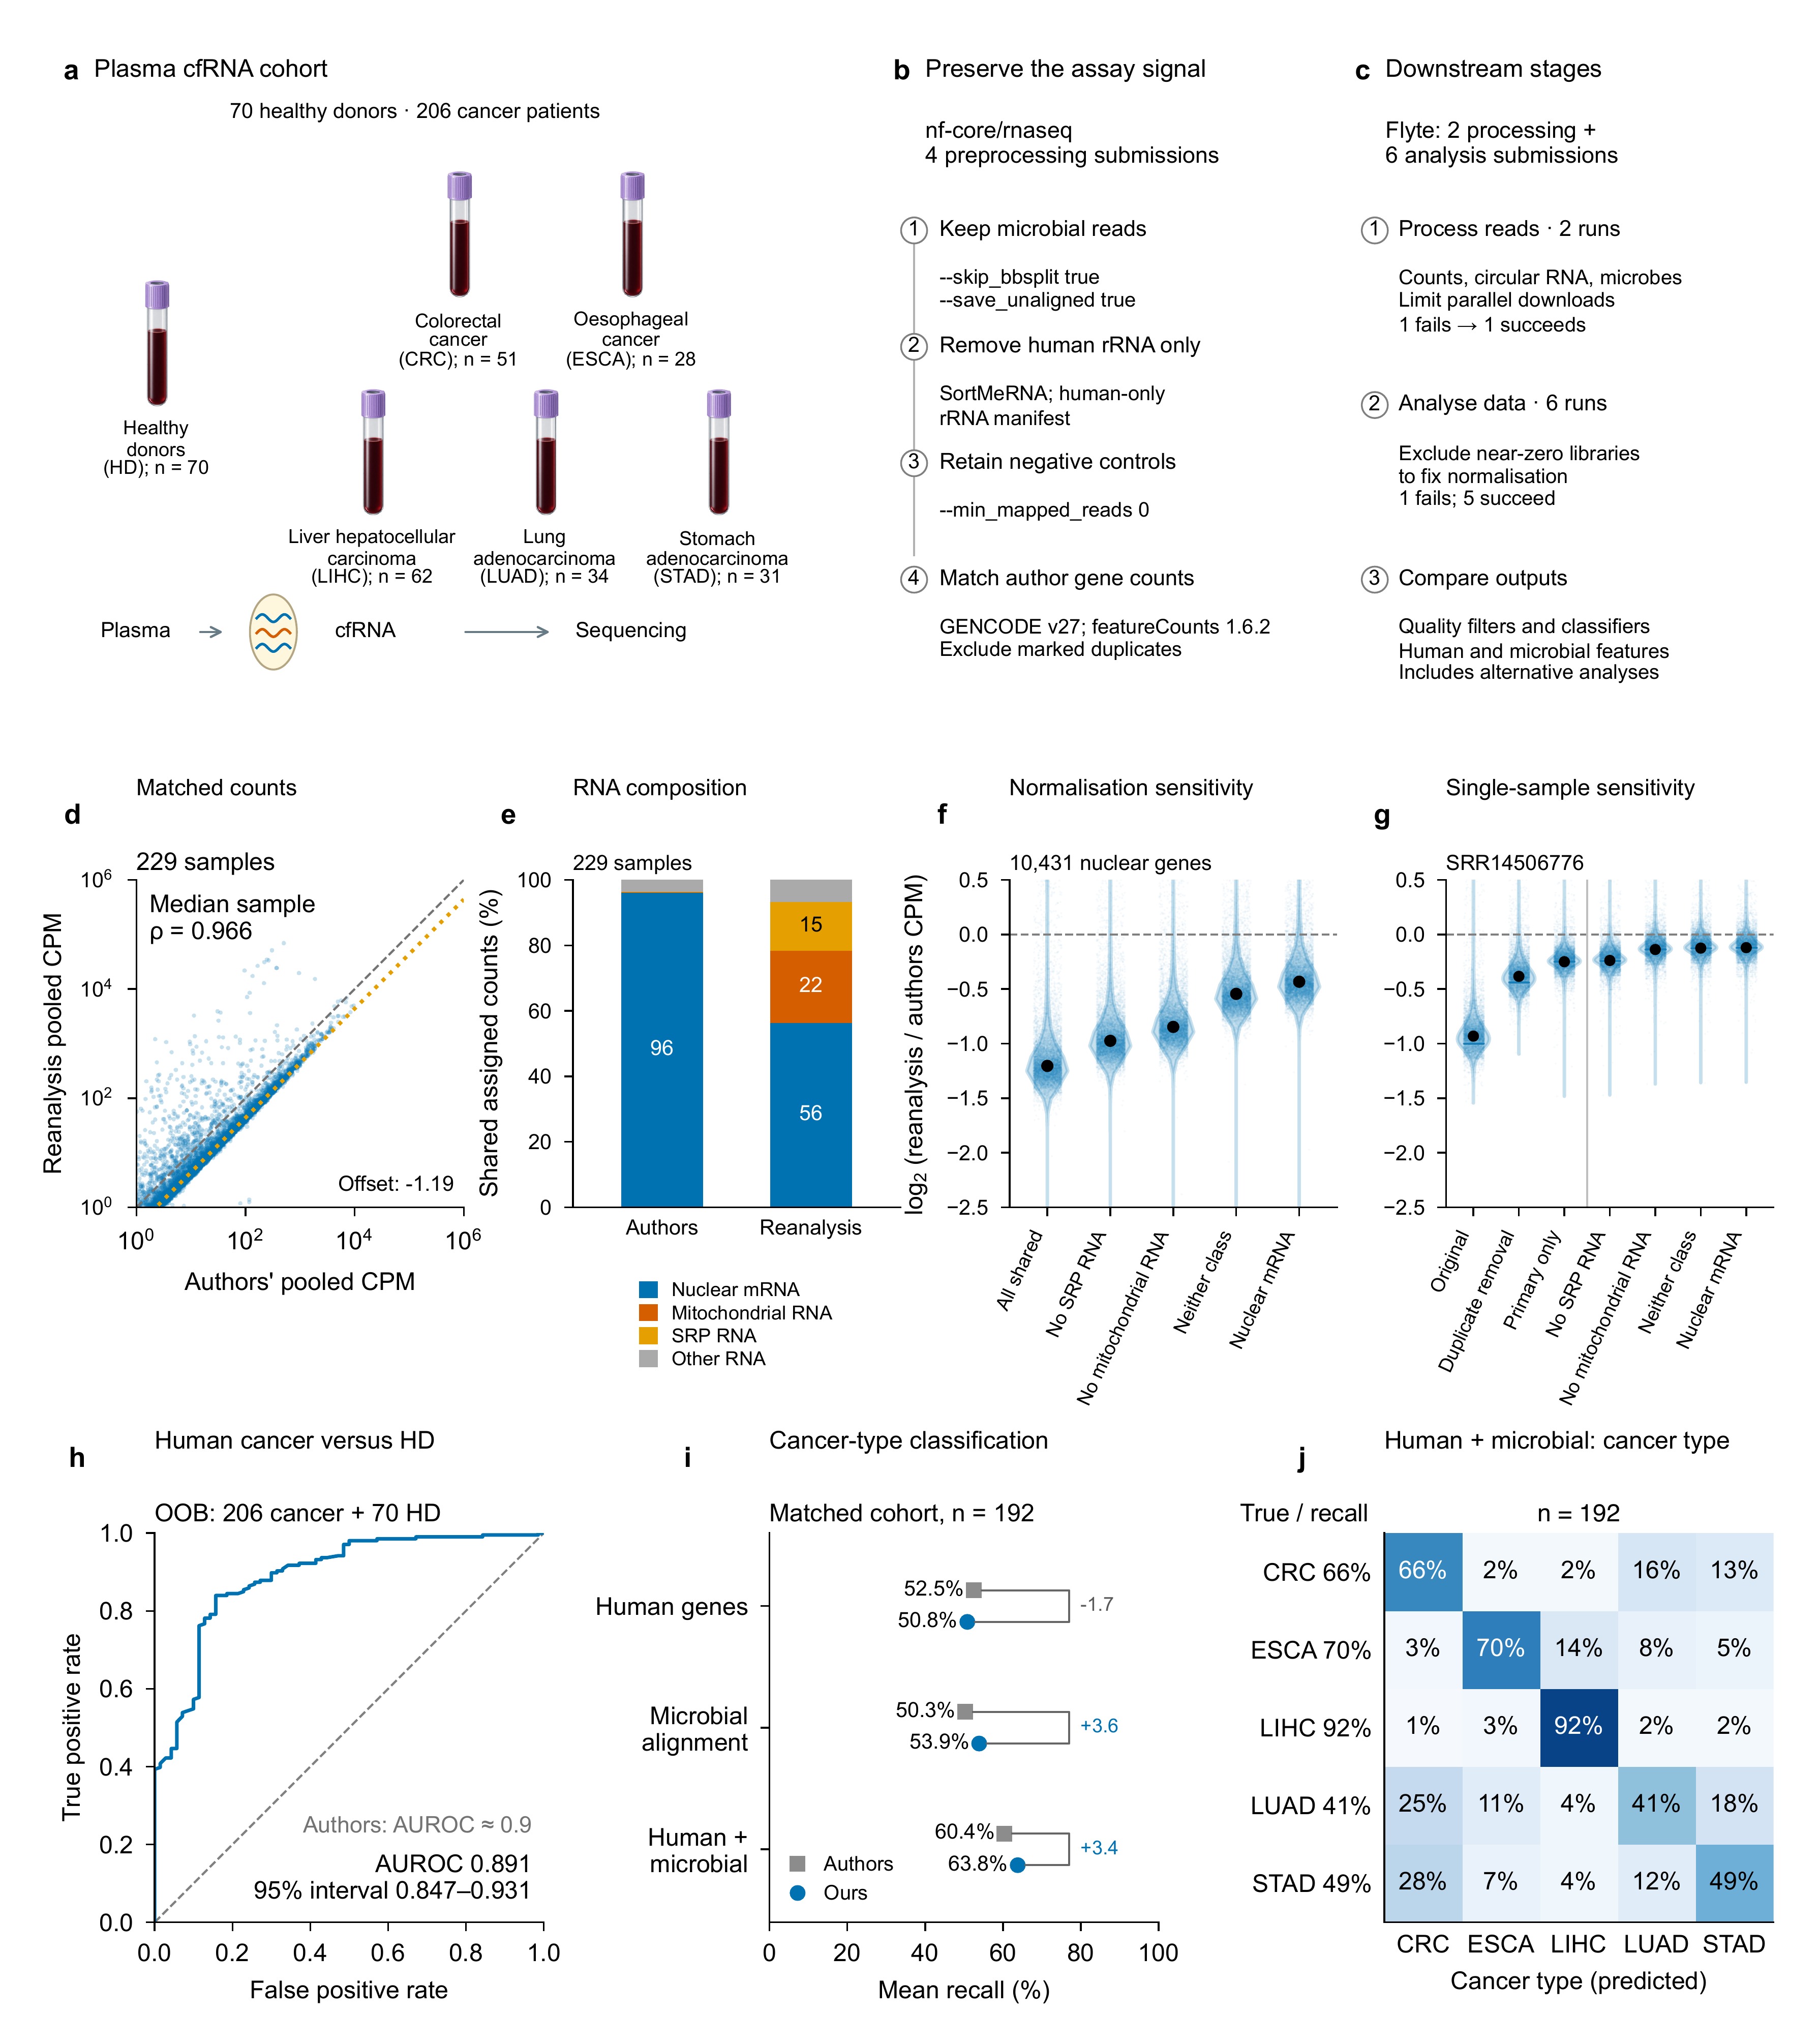
Chen et al. analyse human and microbial plasma transcripts for cancer classification (Fig. 4a)51. Our analysis includes 276 cancer and control samples. Unlike a single disease comparison, this cohort also enables multiclass analysis and patient stratification. Prima Daedalus selected the community nf-core/rnaseq54 pipeline for processing the staged raw reads. Reconstruction required several connected stages. Human gene counts, circular RNA junctions, and two microbial methods all use different references and filters51. For example, reads discarded from human analysis can be essential elsewhere. Prima Daedalus took a hybrid approach by combining nf-core/rnaseq preprocessing with bespoke Flyte tasks around retained reads to address this. Pilot runs exposed three settings that could remove informative molecules (Fig. 4b, c). Setting --skip_bbsplit true preserves non-host reads, while --save_unaligned true retains reads for circular RNA and microbial analysis. The correction illustrates why assay interpretation must guide pipeline configuration. A default that serves one analysis can remove the material required by another. In this case, our correction allowed the connected analyses to proceed without narrowing the biological question.
Across all 229 matched samples, gene-count agreement showed broad consistency with a clear offset (Fig. 4d). Mitochondrial and signal recognition particle RNA contributed approximately 22% and 15% of our shared assigned counts, differing with the author output (Fig. 4e). These differences change the counts-per-million denominator and therefore every normalised gene value. Holding 10,431 nuclear protein-coding genes fixed, different exclusions moved the offset towards zero (Fig. 4f). Further counting corrections and normalisations reduced the median log2 CPM ratio close to 0 (Fig. 4g), thus finding author choices and differences that correlation alone misses.
Next, the agents tried to reproduce the critical findings of the original publication: detection of cancer and classification of distinct cancer types within the cohort based upon circulating transcripts. For cancer-versus-control ranking, area under the receiver operating characteristic curve (AUROC) was 0.891 (95% confidence interval 0.847–0.931), close to the paper’s approximately 0.9 under different evaluation procedures (Fig. 4h). Strikingly, and much more interestingly to us, five-cancer classification often produced higher mean recall scores in our hands when compared to the published results (Fig. 4i). While human genes gave 50.8%, compared with the authors’ 52.5%, microbial classification resulted in 53.9% versus 50.3%, and a whole 63.8% vs. the published authors’ best of 60.4% when combining both predictive features (Fig. 4i, j). Performance improvements are due to a stricter QC threshold introduced by our agents that removed poor-quality samples as well as a modified feature selection methodology. While further improvements of modelling approaches utilised are possible, Prima Daedalus tested in this use case that reproduction is the floor and that multi-agent workflows can easily test alternative analyses leading to improved performance within days.
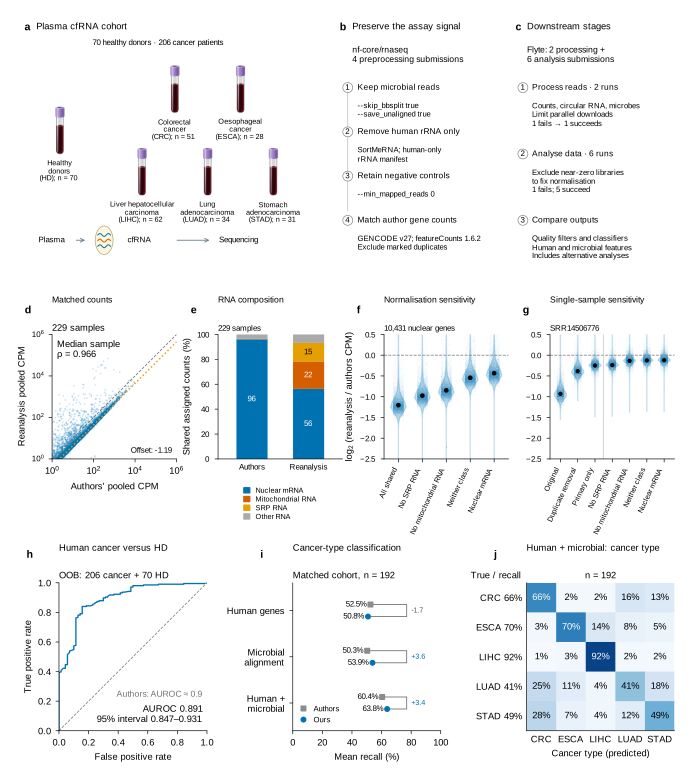
Figure 4. Plasma cfRNA processing, count agreement, and cancer classification.
a, Schematic of the cfRNA cohort. Out of 298 runs, 297 complete processing; 276 pass depth filtering, compared to 263 author samples. b, Processing took four nf-core/rnaseq submissions: two pilots, one full run, and one resume. Prima Daedalus disabled BBSplit with --skip_bbsplit true to retain non-host reads, saved unaligned reads with --save_unaligned true for circular RNA and microbial analysis, and selected SortMeRNA with a human-only ribosomal RNA reference to preserve microbial ribosomal RNA. Further corrections retained microbial controls, matched GENCODE to v27 and featureCounts to v1.6.2, excluded duplicate-marked reads, and specified necessary reverse-stranded controls. c, Two Flyte processing submissions resolved excessive parallel downloads. Six analysis submissions tested quality filters and microbial features; five succeed after near-zero-library filtering fixed normalisation. Counts here exclude downloads or small tests. d, Pooled counts per million (CPM): 229 matched samples with 11,703 expressed genes. Median sample raw-count Spearman ρ = 0.966 across 37,303 shared genes. Grey dashes indicate equality; orange dots, median log2 ratio = −1.19 (ours/authors ≈ 0.44). e, Shared-count fractions: nuclear messenger RNA (mRNA), mitochondrial RNA (mtRNA), signal recognition particle RNA (srpRNA), and other RNA. f, Denominator comparison: 10,431 fixed nuclear protein-coding genes. Violins/transparent points show log2 ratios; black points, medians. Displayed figure is zoomed in to the −2.5–0.5 range without restricting the underlying data distributions. “Neither class” excludes both mtRNA and srpRNA. g, Single-sample diagnostic on sample SRR14506776 across the 7,794 nuclear genes that retain ≥ 10 counts in every counting arm and the author matrix. Original, read-name-deduplicated, and nonduplicate primary-only counts, followed by removal of srpRNA, mtRNA, or both, or retaining nuclear-encoded mRNA only. Points and medians follow f. h, Human-gene out-of-bag (OOB) area under the receiver operating characteristic curve (AUROC): 0.891, versus author mean bootstrap-test ≈ 0.9. i, Mean recall using human, microbial alignments, or both, under the five-way multiclass cancer classification setting, revealing the higher scores under a different evaluation in Prima Daedalus’ approach for the last two. Recall weights five cancers equally. j, Microbial alignment-based five-way classification confusion matrix. Raw reads were fetched from SRA (BioProjects PRJNA729258 and PRJNA598835). Author-provided data objects in d–g were fetched from GEO (GSE174302). Modelling results in h–i included additional data fetched from GEO (GSE142987) as well. Study: Chen et al. (2022)51.
Case study 3: Measuring cumulative access to the genome for chromatin dynamics modelling
At a glance | This case study shows Prima Daedalus's ability to build a bespoke pipeline for an assay with no existing tooling, preserving counting rules that standard processing would break. Its measurements matched the authors' down to loci, providing granular training targets for modelling, and captured what snapshot assays miss, showing that even "closed" heterochromatin becomes accessible within days.
Our last use case delves into a rare but potentially valuable epigenomics profiling technology. Quantitative DNA accessibility sequencing (qDA-seq) is an alternative to the more widely used ATAC-seq and DNase-seq to profile the degree of compaction or looseness of chromatin at different genomic loci. Its main advantage is that it measures the fraction of DNA molecules reached by a methyltransferase over time, beyond a static open-or-closed label. These continuous measurements offer possible targets for modelling chromatin accessibility, while requiring different interpretation from an instantaneous accessibility measurement.
Prajapati et al. showcased using a DNA adenine methyltransferase (Dam) in living MCF-7 breast cancer cells to profile chromatin accessibility55. Dam marks adenine within GATC sequences, adding a methyl moiety that acts as a proxy marker of accessibility. DpnI digestion then converts those marks into a sequencing readout without isolating nuclei. This unusual assay is valuable to us because its cumulative measurements capture a distinct aspect of chromatin biology. At the same time, it is also a perfect example of the kind of method that limited onboarding time can frequently leave unexplored.
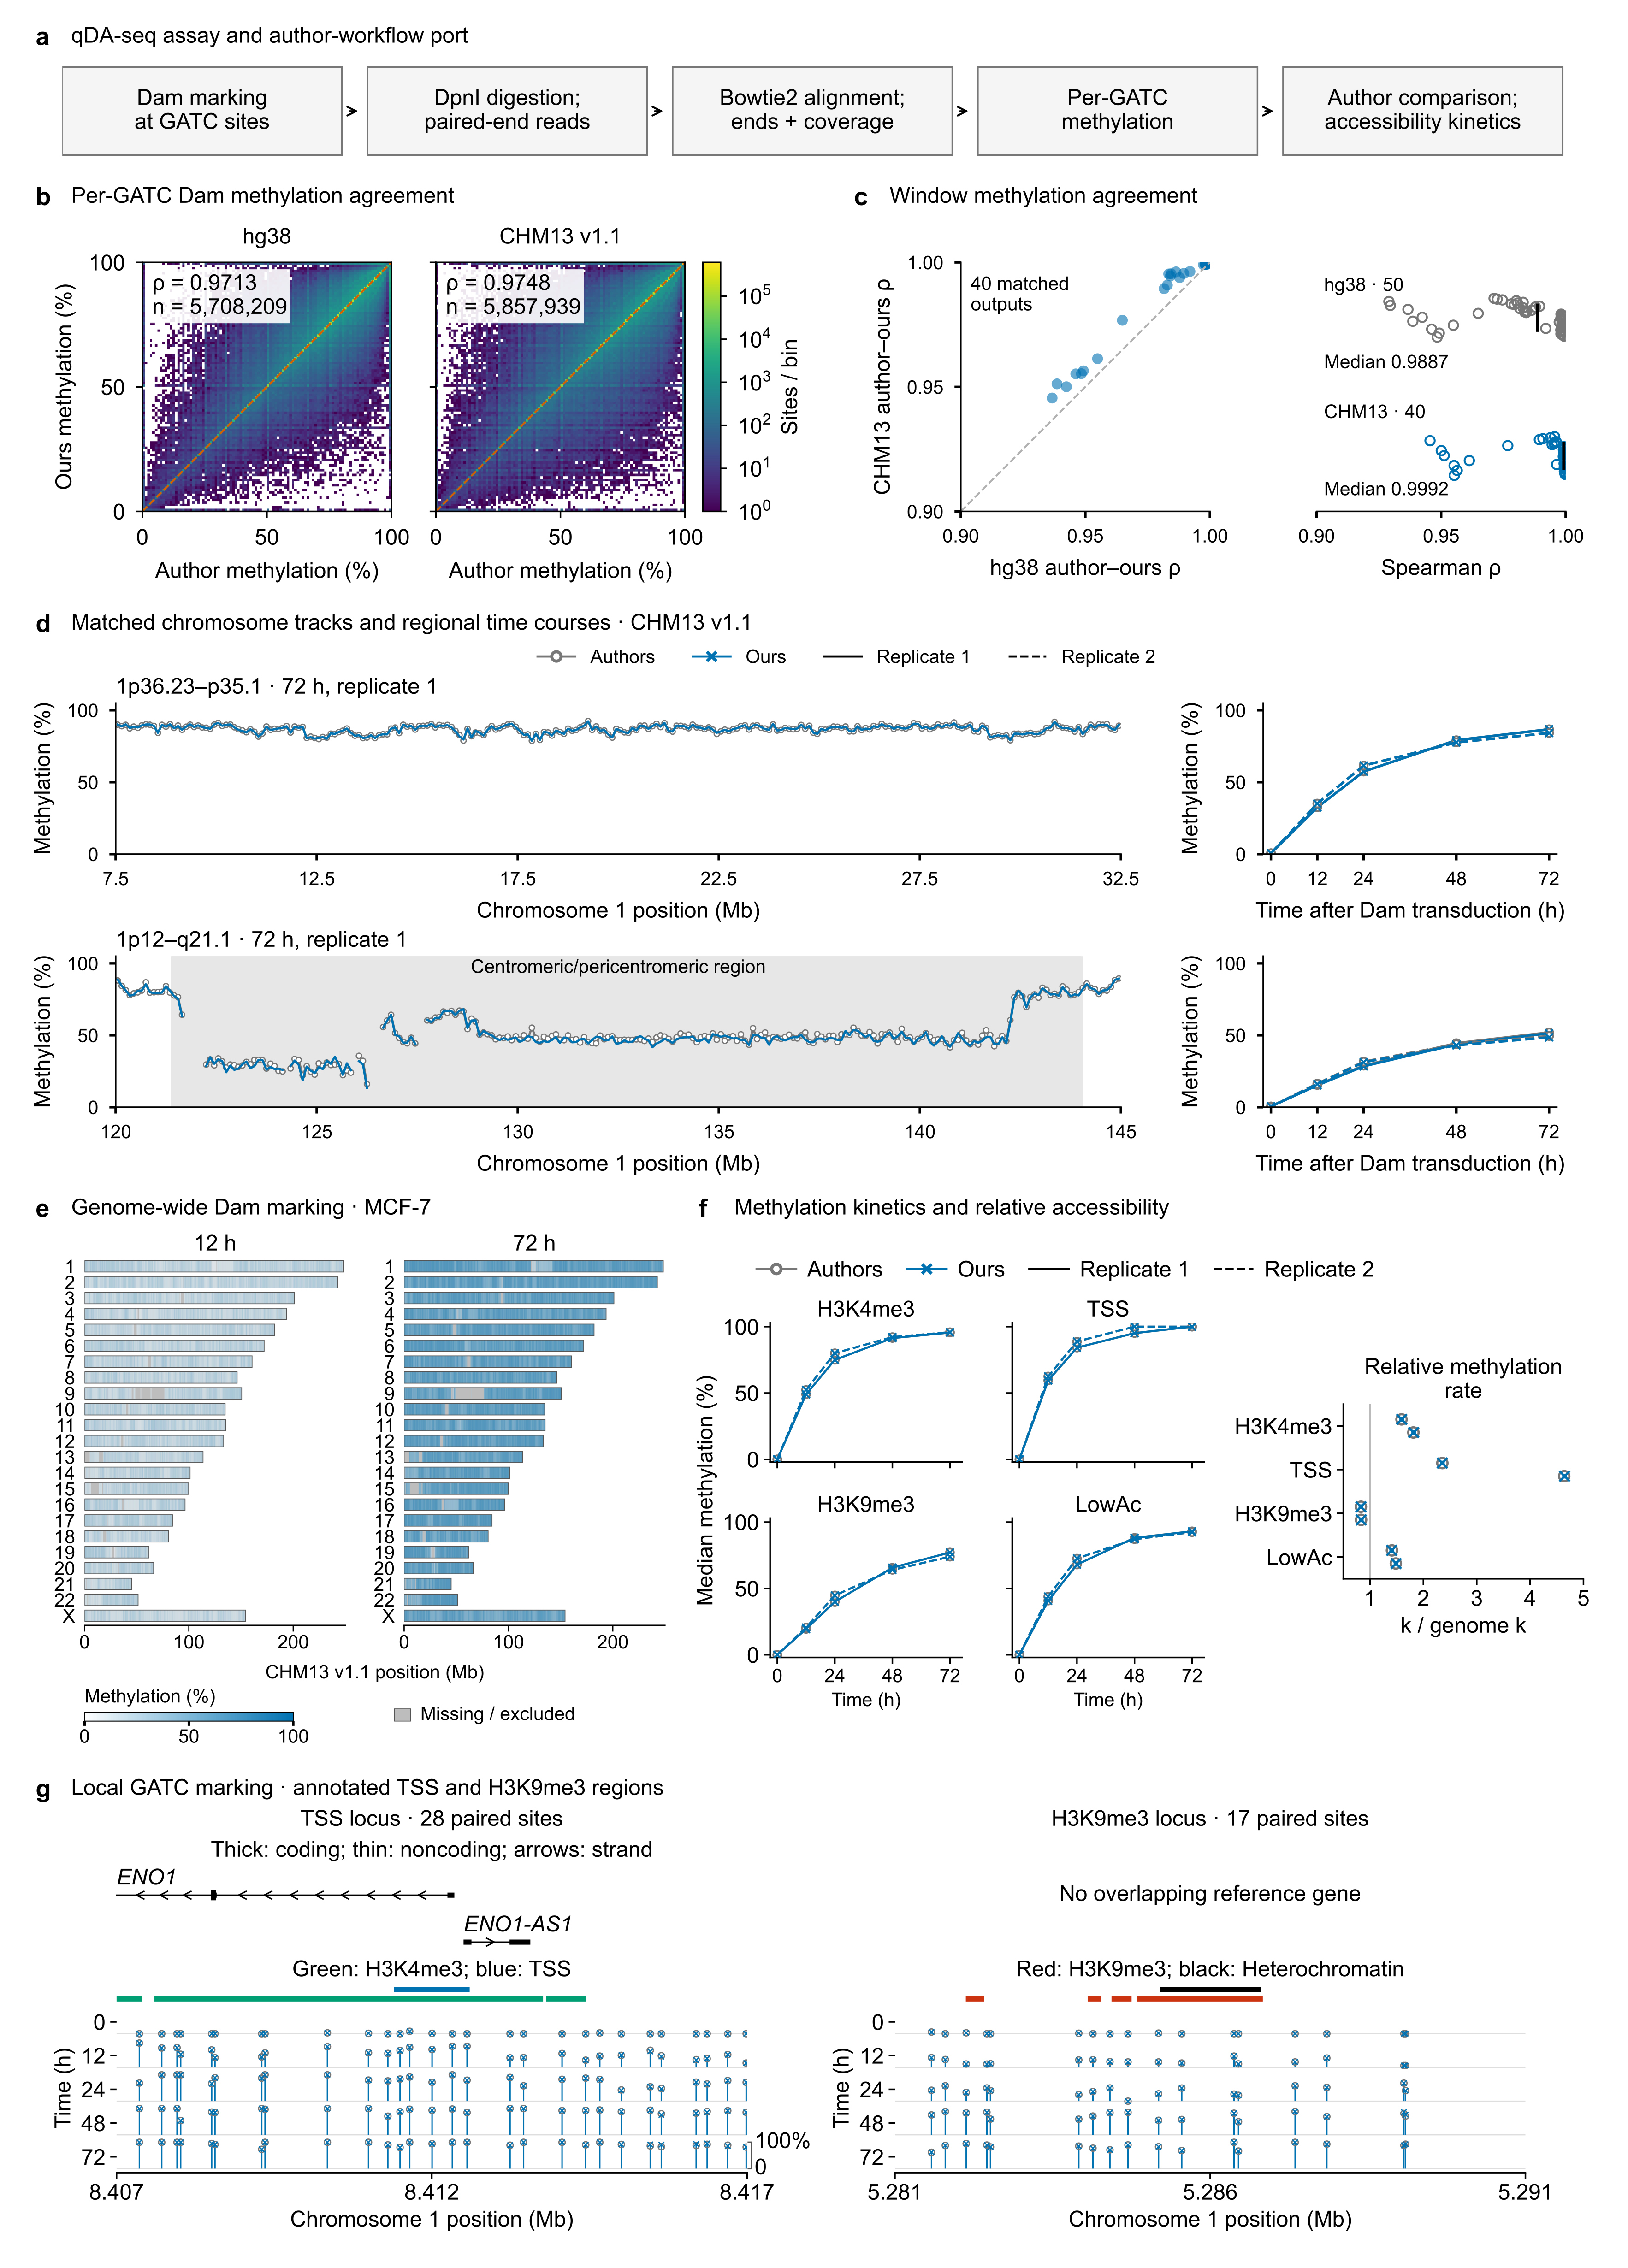
Prima Daedalus fetched the raw data and ported the authors’ calculations into a bespoke Flyte workflow (Fig. 5a). Fragment ends and local coverage define the measurement in this pipeline, with conventional duplicate removal being undesirable here, as it would erase genuine fragments sharing a restriction site that processing must preserve. This is a case where a familiar cleanup step would damage the intended measurement, erasing signal to be picked up by foundation models trained downstream.
To check that Prima Daedalus reproduced the authors' processing, we compared our methylation values with theirs. Agreement was high at individual GATC sites, with a median correlation of ~0.98 on both the hg38 and CHM13 assemblies (Fig. 5b), and near-perfect across 100-kb windows (Fig. 5c). Representative chromosome arms and a similarly sized chromosome 1 centromeric/pericentromeric region recover the expected contrast between regions (Fig. 5d). After 72 hours of Dam exposure, mean window methylation reaches 86.8% and 84.2% genome-wide, compared with 51.4% and 48.6% in the centromeric region. Maps across chromosomes 1–22 and X extend the comparison across the genome, reproducing authors’ findings (Fig. 5e). Reanalysis with a rate estimator also recovers faster methylation at H3K4me3-marked promoters and transcription start sites (TSS) than in H3K9me3-rich heterochromatin and low-acetylation states (Fig. 5f). Moreover, we go beyond and prove with Prima Daedalus’ analysis that qDA-seq retrieves enough signal for individual locus modelling, with GATC sites and clusters of them retaining locus-specific dynamics (Fig. 5g).
Importantly, despite H3K9me3 heterochromatin regions having rates near 0.83 times the genome rate, we showed how they continue to accumulate methylation. This continuing gain is the biological point exclusively captured by qDA-seq that opposes traditional chromatin dogmas, and that we can now explore. By recording cumulative access, qDA-seq proves that even traditionally designated closed regions show stochastic changes in chromatin structure that make these regions transiently accessible over a time period of just a few days. In this way, Prima Daedalus shows through this case study its ability to preserve both an assay’s unusual counting rules and the biological meaning of its output.
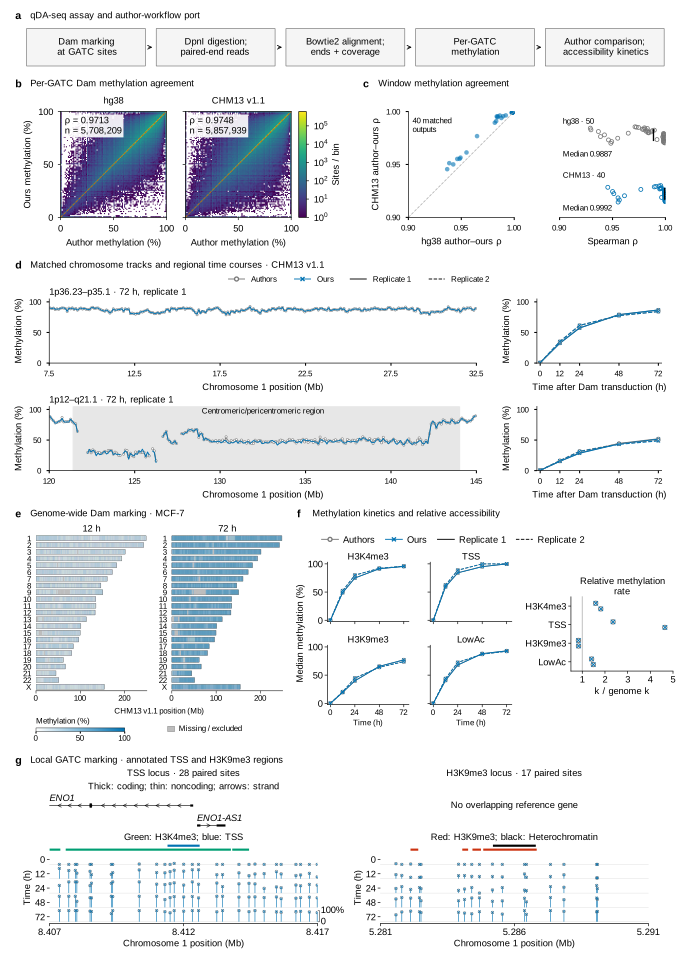
Figure 5. Reproducing quantitative chromatin-accessibility measurements and their kinetics.
a, qDA-seq library preparation and data processing and analysis fundamentals. Dam methylation and DpnI digestion generate the qDA-seq readout. The Flyte workflow retains repeated fragment ends and assay-specific filters. b, Paired adenine methylation, as a proxy of chromatin accessibility, per individual GATC in the genome, in replicate 1 of the 72 h post-Dam transduction experiment in MCF-7 live cells. n denotes the number of matched sites in both assemblies. Dashed diagonal lines mark equality. c, Scatter plot comparing the within-assembly author–ours correlations over 100-kb methylation windows for the shared output across assemblies (n = 40). Black bars, median. d, CHM13 chromosome 1 tracks at 72 h post-Dam transduction, replicate 1, appearing beside the corresponding time courses from both replicates. Grey: author-called centromeric/pericentromeric interval, 121.405–144.009 Mb. e, Two columns show chromosomes 1–22 and X at 12 h (left) and 72 h (right). Each averages both replicates over 29,774 fixed windows. White–blue gradient shows cumulative methylation marking / accessibility; grey denotes missing/excluded data. f, Feature-median time courses and relative methylation / accessibility rates across four different chromatin states, using the authors’ estimator through a fit of ln(1−methylated fraction) against time. LowAc, low-H3K27ac state; H3K4me3/H3K9me3, histone H3 lysine 4/9 trimethylation; H3K27ac, lysine 27 acetylation; k, fitted rate. g, Coordinate-selected 10 kb H3K4me3-decorated transcription start site (TSS) and H3K9me3-rich heterochromatin windows, with 28 and 17 paired GATC sites, respectively, depicting the site- and locus-specific resolution of the qDA-seq technology. Stems show our methylation; grey circles show author values, both on 0–100% scales. Green, red, blue, and black bars mark H3K4me3, H3K9me3, TSS, and heterochromatin, respectively. Raw reads were fetched from SRA (BioProjects PRJNA1190914, PRJNA1190913, PRJNA1240587, PRJNA1190915, PRJNA1240591, and PRJNA1240588). Author-provided data objects were fetched from GEO (GSE282872, GSE282873, and GSE292648). Study: Prajapati et al. (2025)55.
Ground truth evals for better models
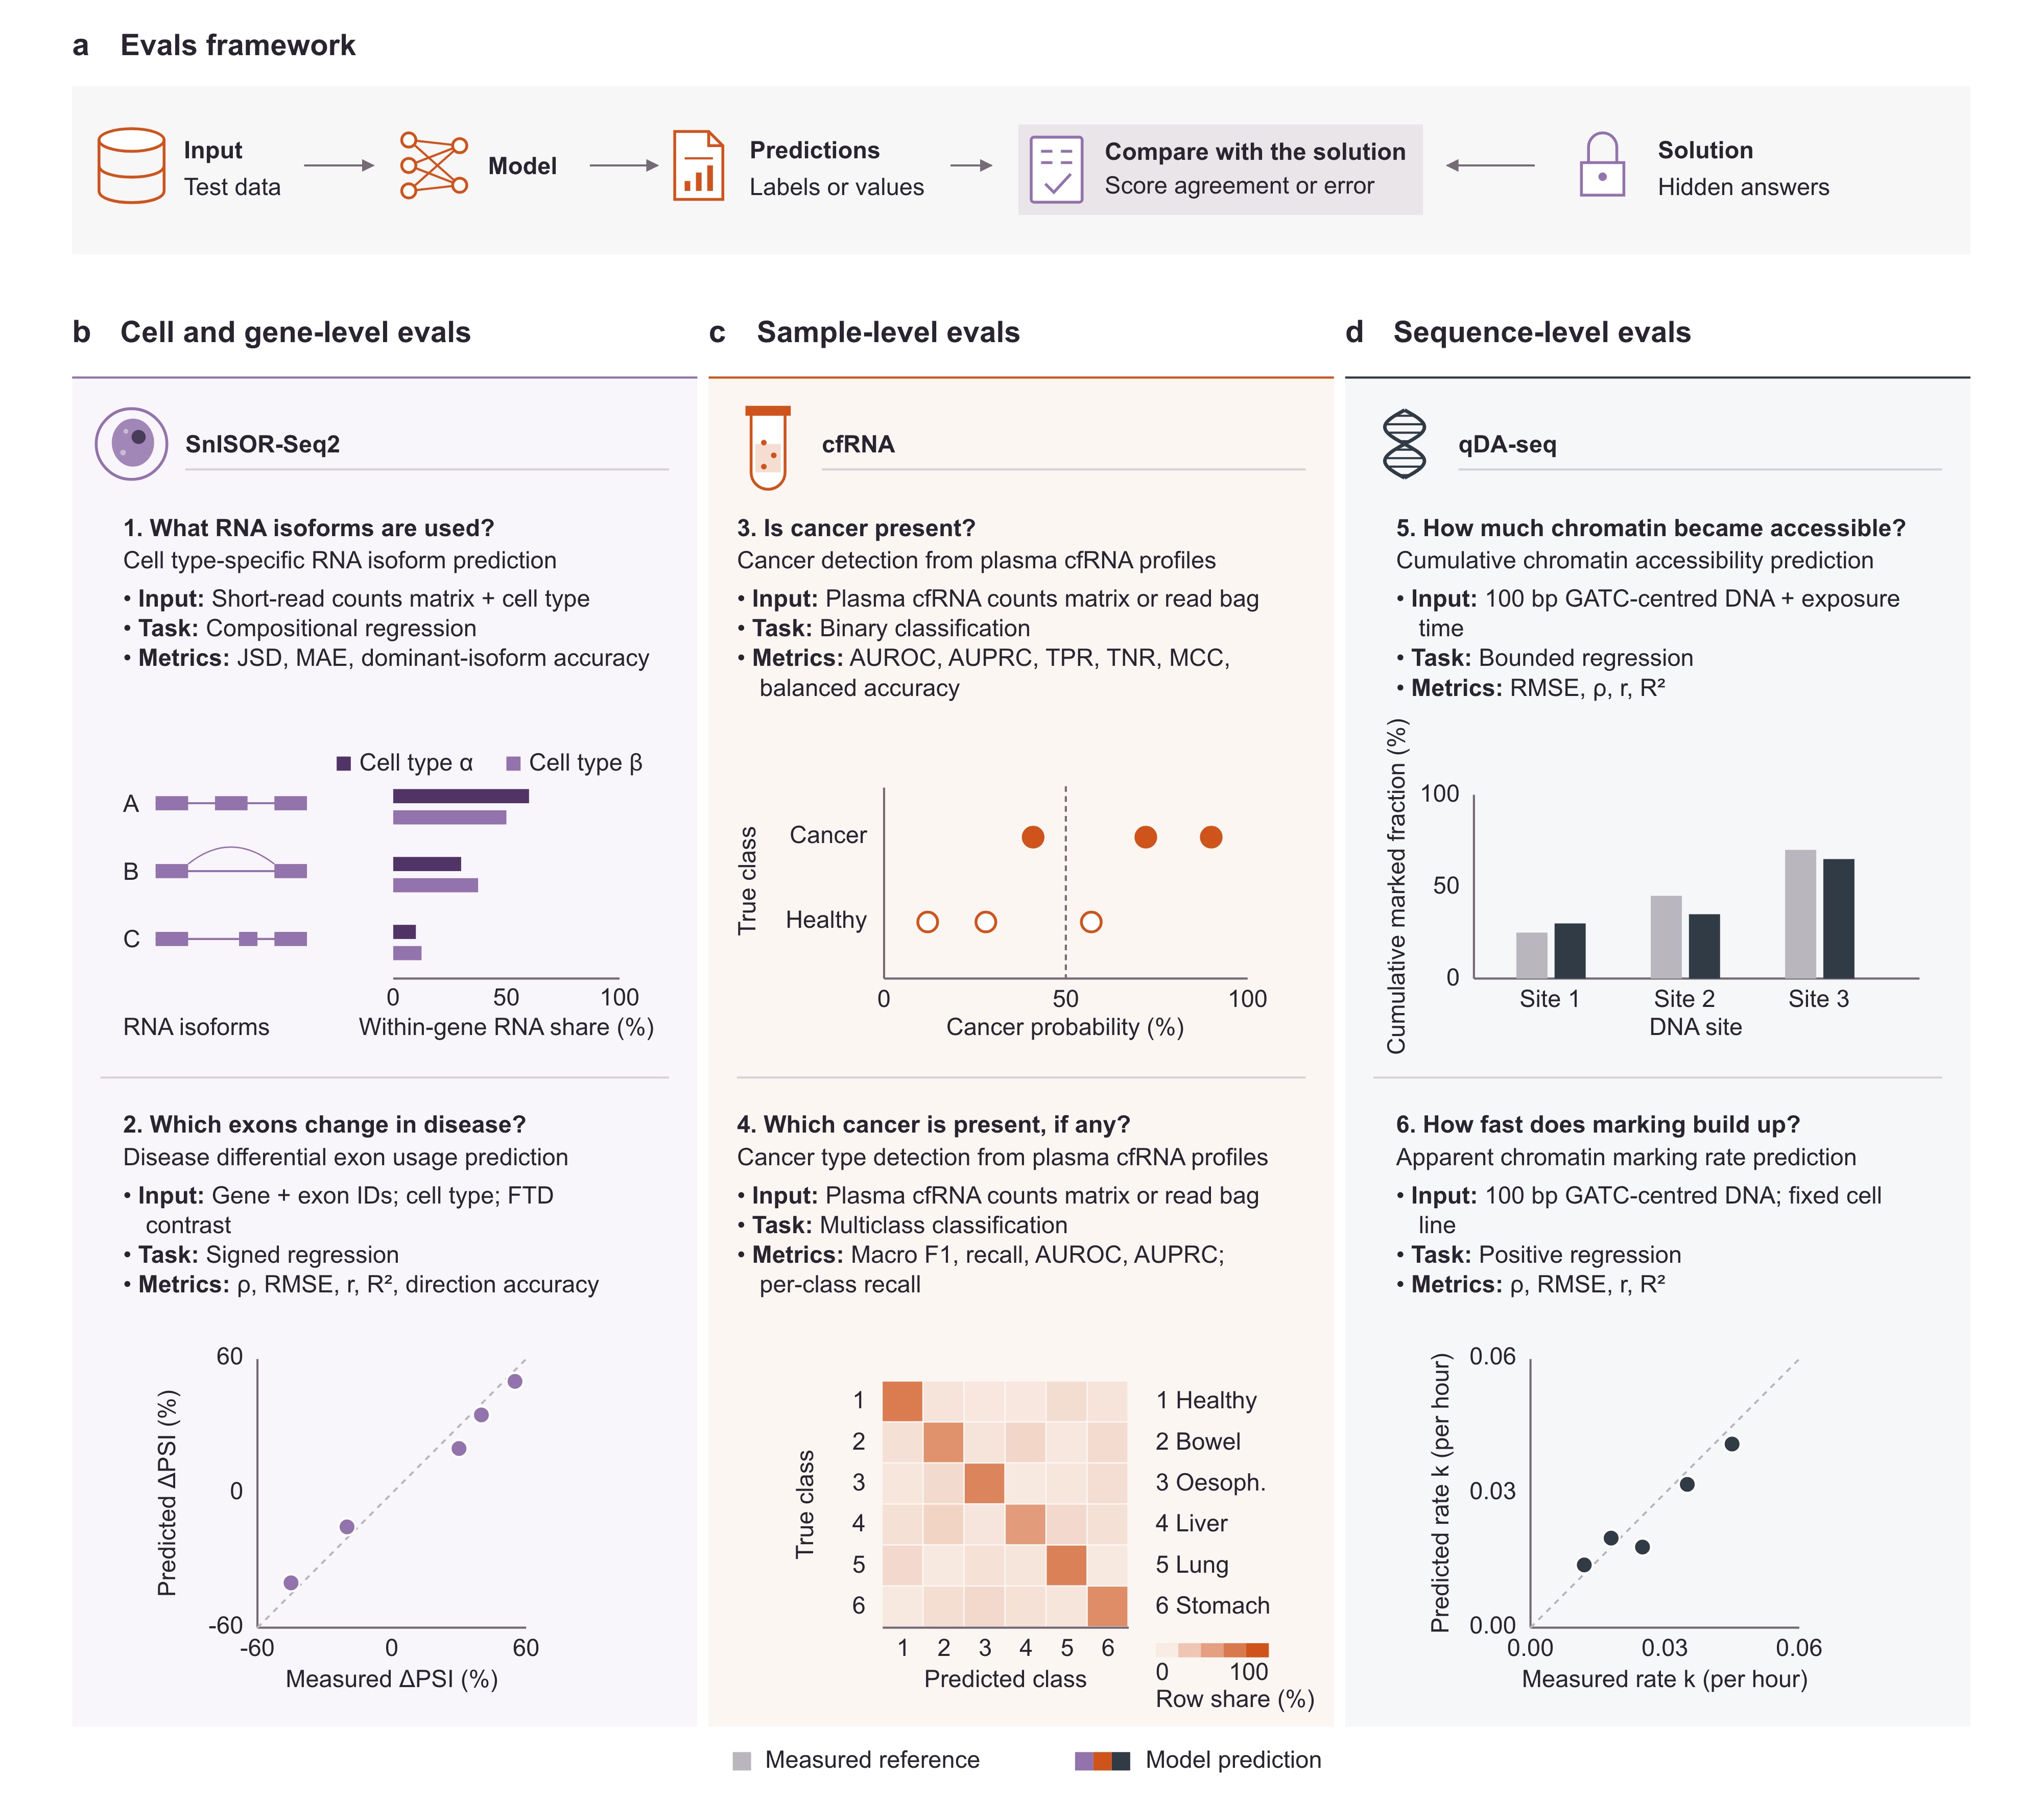
For us, the value of these datasets extends to the questions they allow us to ask our models. Here, we propose six evals across the three case studies that show how to systematically interrogate and benchmark cell, gene, sample (or donor), and sequence-level model embeddings and predictions (Fig. 6a–d). SnISOr-Seq2 data supports predicting within-gene isoform proportions for a cell type and disease-associated changes in exon inclusion (Fig. 6b). Plasma cfRNA supports detecting cancer and distinguishing healthy samples from five cancer types (Fig. 6c). Lastly, qDA-seq supports predicting the cumulative marked fraction from DNA sequence and exposure time, and apparent marking rates from sequence (Fig. 6d). These last two tasks test cumulative accessibility, with measurements that also reflect the assay’s properties.
These evals can now become part of our growing suite of prima-bench evals, our internal suite of biological evals that will be released soon. For each task, we compare model predictions with hidden reference values to measure agreement or error (Fig. 6a). Moreover, the six tasks here are simply representative examples; the list is not exhaustive. A single dataset can yield dozens of different evals, spanning multiple biological questions, model inputs, and prediction targets. Prima Daedalus makes more datasets available for this purpose, allowing us to expand prima-bench alongside the science we pursue.
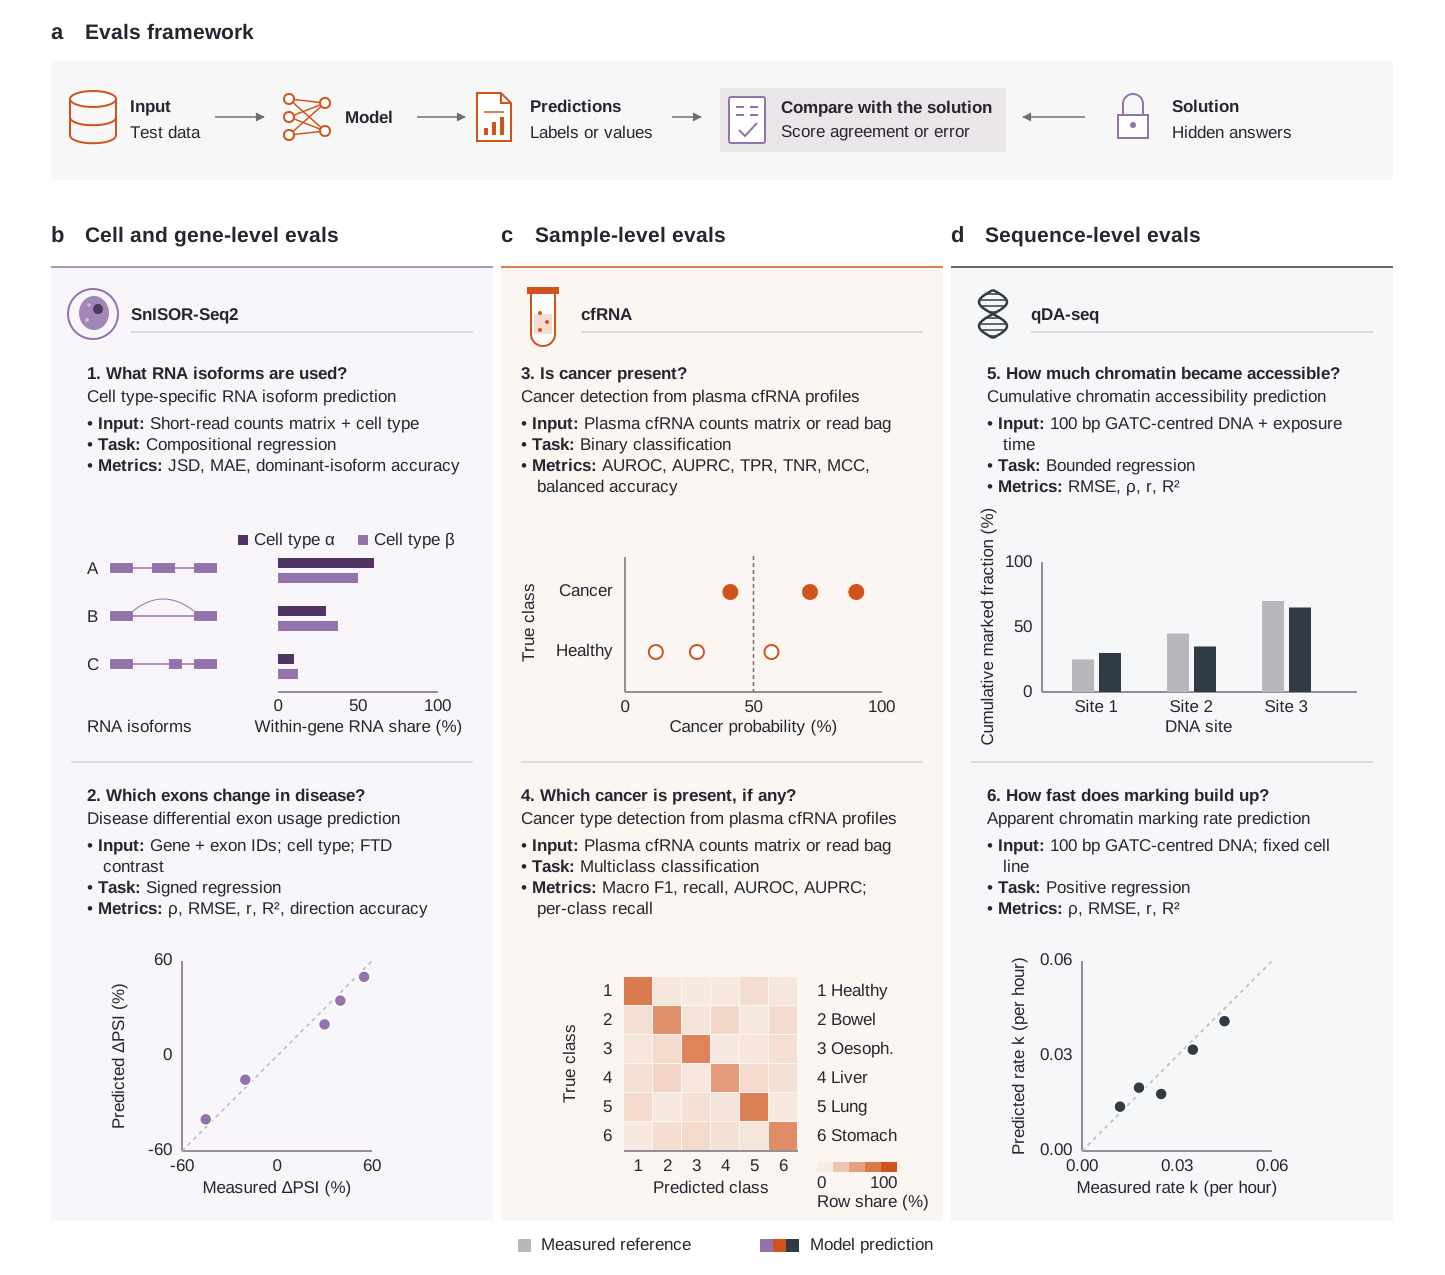
Figure 6. Candidate evals to test cell, gene, sample, and sequence-level model embeddings and predictions.
a, Evals framework. A model receives test inputs and produces predictions. The evaluator compares these predictions with a hidden solution to score agreement or error. b, Cell and gene-level evals from SnISOR-Seq2. 1, Predict within-gene RNA isoform shares for a cell type. Dark and light violet show example profiles for cell types α and β. JSD, Jensen–Shannon divergence; MAE, mean absolute error. 2, Predict disease-associated changes in exon inclusion from gene and exon IDs, cell type, and the frontotemporal dementia (FTD) contrast. ΔPSI is exon inclusion in FTD minus control; values are shown on a percentage scale. RMSE, root mean squared error; ρ, Spearman correlation; r, Pearson correlation; R², coefficient of determination. c, Sample-level evals from plasma cfRNA. 3, Detect cancer from RNA counts or a bag of reads. The dashed line marks a decision threshold. AUROC, area under the receiver operating characteristic curve; AUPRC, area under the precision–recall curve; TPR, sensitivity; TNR, specificity; MCC, Matthews correlation coefficient. 4, Predict healthy status or one of five cancer types. Confusion-matrix shading shows the percentage assigned to each predicted class within a true class. F1, recall, AUROC, and AUPRC use macro averaging; per-class recall is also reported. d, Sequence-level evals from qDA-seq. 5, Predict cumulative marked fraction from a DNA window and exposure time. 6, Predict the apparent marking rate from DNA sequence. The 100 bp input window is a proposed setting. qDA-seq marking provides a cumulative accessibility readout; its apparent rate also depends on the assay. Grey bars show measured reference values. Diagonal dashed lines mark equal predicted and measured values. All plots are schematic examples, not measured model results.
Days, not months: measuring time and cost savings
After running these case studies, we felt that Prima Daedalus had largely accelerated each process in real time and resulted in significant cost reductions. We interrogated this with a retrospective analysis including estimated manual and AI-assisted schedules, revealing large gains in both time and cost efficiency with Prima Daedalus' agentic AI workflows.
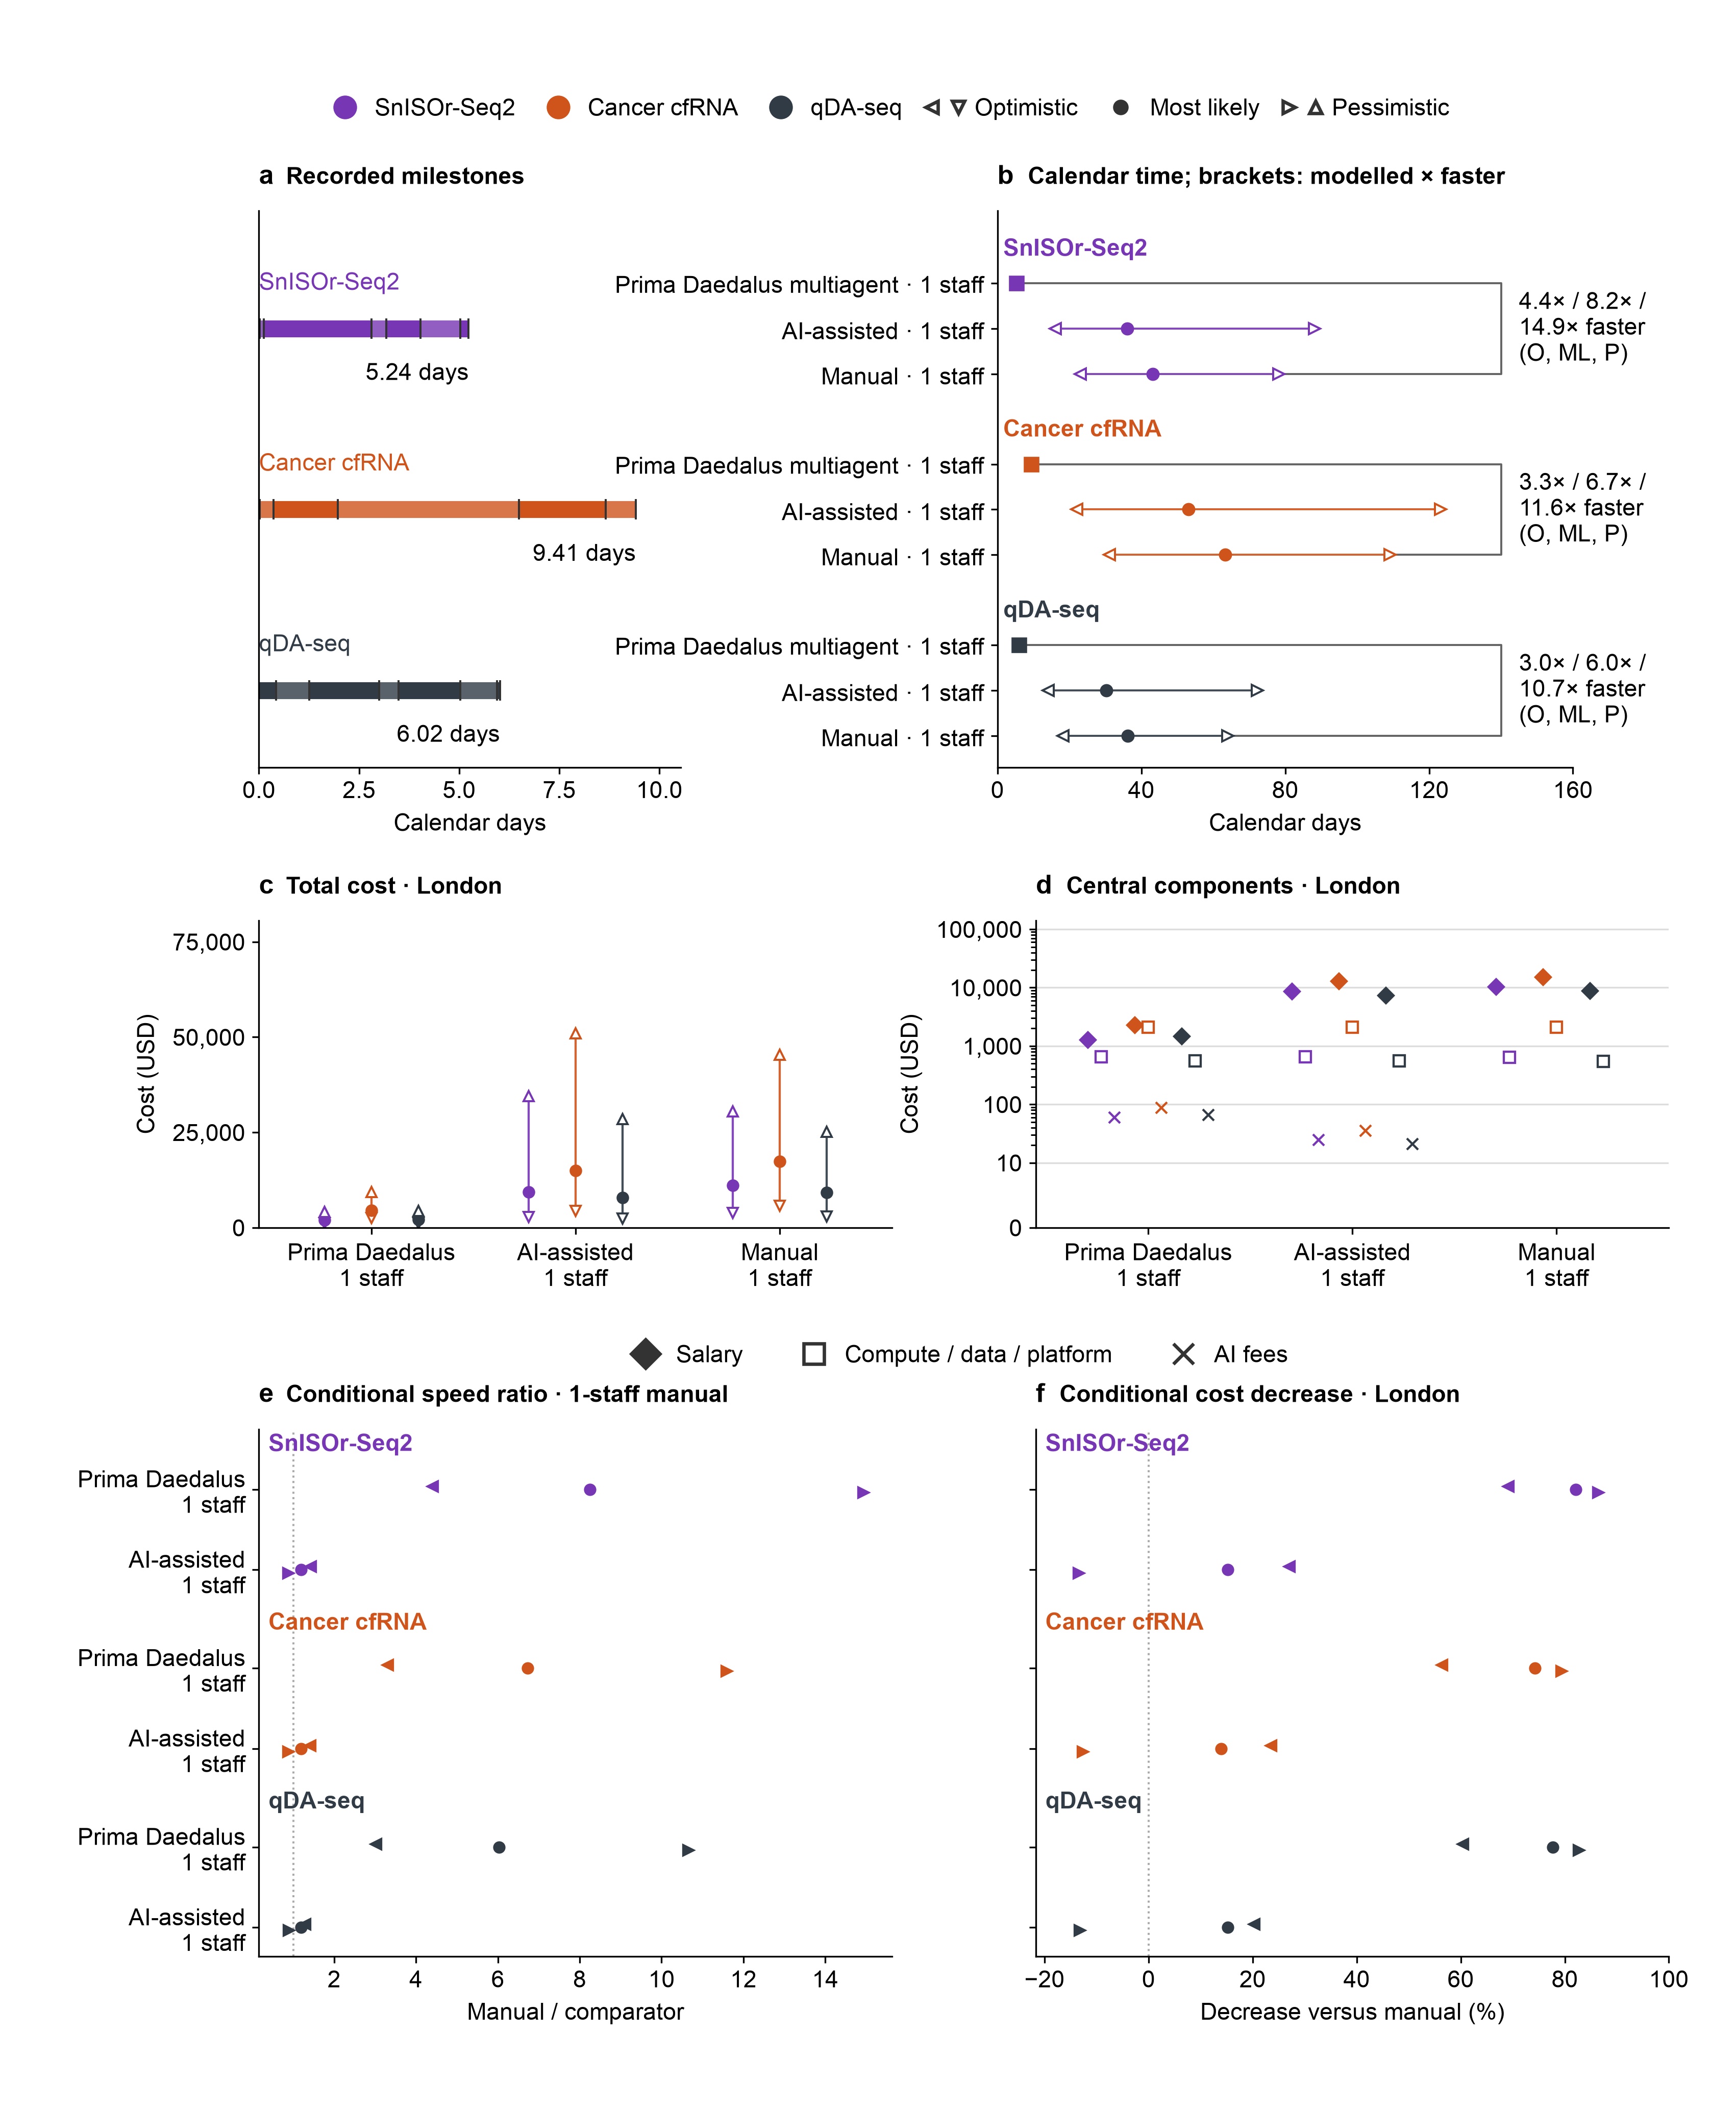
Recorded delivery time intervals were 5.24 days for SnISOr-Seq2, 9.41 days for cfRNA, and 6.02 days for qDA-seq (Fig. 7a, b). However, these records do not separate active work from waiting, with further compression possible through reduced human gating, and they do not measure the effort of the scientists either. Figure 7 compares the intervals and estimated associated costs with assumed manual and human-directed AI-assisted schedules. Following published guidance, estimates include onboarding, validation, and downstream analysis56,57. We assume six project hours per weekday and one or two full-time employees. Optimistic, central, and pessimistic scenarios combine effort, salary, and service assumptions for London, San Francisco and other global cities, with the total costs including base salary, computing, data services, and applicable AI usage fees (Fig. 7c, d).
One-person manual schedules are 8.2× longer than the recorded SnISOr-Seq2 interval (optimistic–pessimistic range, 4.4–14.9×), 6.7× the cfRNA interval (3.3–11.6×), and 6× the qDA-seq interval (3.0–10.7×) (Fig. 7b, e), revealing meaningful efficiency improvements with agentic AI workflows. Modelled cost reductions are impressive, at 56–89%, 40–83%, and 50–85%, respectively, for each case study (Fig. 7f). Fewer salary-charged calendar days drive most of the difference. Under central assumptions, multi-agent model fees equal approximately 2.2–14.5% of assigned one-person salary costs across the six cities (Fig. 7d), revealing how low the costs of well-designed AI workflows in the sciences are.
Interestingly, pessimistic AI-assisted scenarios are 8.7–16.8× longer than the recorded intervals and cost 12–16% more than matched manual scenarios (Fig. 7f). Unsurprisingly, this highlights that AI tools alone may not always yield efficiency improvements without the appropriate frameworks and infrastructure, like Prima Daedalus. We hypothesise that when a scientist directs AI tools without a surrounding framework, catching errors like the non-default parameters we used for cfRNA processing depends entirely on their own vigilance, and the time spent checking and correcting AI output can outweigh the time it saved.
Altogether, we show how there is clear need for dedicated workflows like Prima Daedalus: they let us do more science with the same team at a lower cost with no compromise on rigour, reproducibility, or scientific judgement.
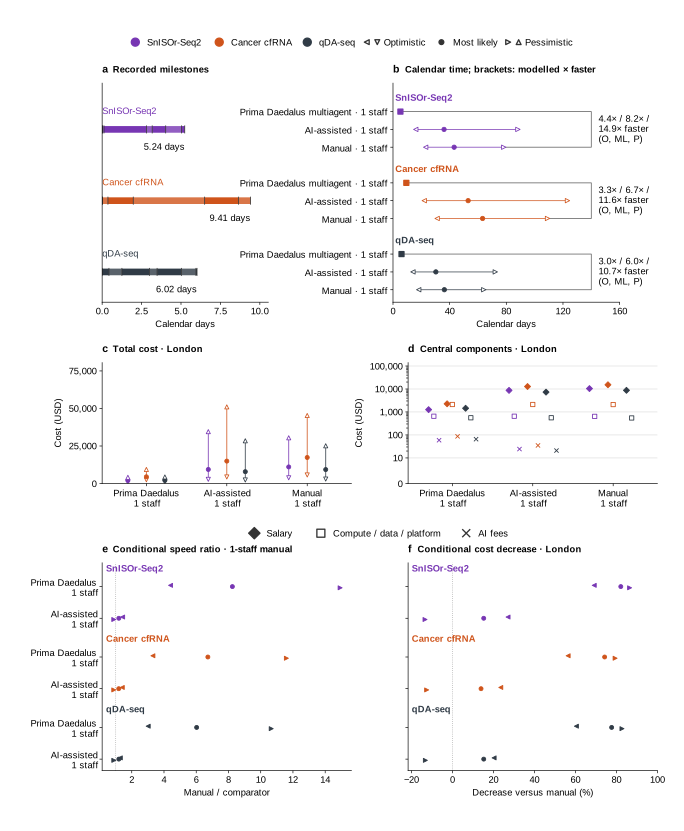
Figure 7. Recorded delivery times and conditional time–cost comparisons.
a, Recorded delivery times for the three use cases, with individual milestones highlighting work and waiting times. Ticks identify source events; shades distinguish consecutive intervals. b, Calendar time from recorded Prima Daedalus delivery time and estimations for AI-assisted and manual scenarios with the selected number of staff on the task; Prima Daedalus always has 1 staff. O, ML, P: optimistic, most-likely, and pessimistic scenarios. Brackets compare multi-agent vs. manual scenarios with the selected number of staff. c, Total modelled cost for the three use cases in the selected city, in USD. Downward triangles, circles, upward triangles represent the optimistic, most likely, and pessimistic scenarios, while colours depict each of the three case studies. d, Central components of the total costs shown in c. Diamonds, salary; squares, compute, data, and platform; crosses, AI fees. Zero AI fees in the manual case were omitted. e, Conditional speed ratio, depicting the acceleration (or lack thereof) of Prima Daedalus multi-agent framework and AI-assisted scenarios over the manual calendar days. f, Cost decrease in the selected city, calculated as 100 × (1 − comparator/manual). Negative numbers here mean higher cost than in the manual scenario. Panels e and f share row labels. The figure shows London with 1 staff; the interactive version switches between London, San Francisco, New York, Singapore, Taipei, and Abu Dhabi, and between 1 and 2 staff. Prima Daedalus is always costed with 1 staff; only the AI-assisted and manual scenarios switch between 1 and 2 staff. Costs in c and d are shown in USD for every city. Each panel keeps its axis when the city changes; the axis in c differs between the 1-staff and 2-staff versions so that the spread of costs stays visible. Multi-agent time is recorded; human comparators are assumed, not measured productivity or realised savings. AI assistance is human directed, without orchestration. Active person-hours determine AI usage estimates. Calculations for cost were based on salary estimates as follows. Salary = annual salary × assigned staff × elapsed calendar days / 365, including waiting. Salaries in O, ML, and P scenarios: 40,000, 65,000, and 100,000 GBP in London; 90,000, 150,000, and 205,000 USD in San Francisco; 85,000, 140,000, and 195,000 USD in New York; 60,000, 100,000, and 145,000 SGD in Singapore; 550,000, 900,000, and 1,400,000 TWD in Taipei; and 190,000, 380,000, and 560,000 AED in Abu Dhabi. Other cities match the London model’s salary percentiles (about the 13th, 58th, and 86th) for bioinformatics and AI/techbio roles. These are modelled percentiles, not observed local salary quantiles. Monthly base salaries are multiplied by 12. Manual and AI-assisted schedules assume six project hours per weekday, serial work, coordination, and residual waits. 2-staff scenarios are less than the addition of 2 individual employees, as serial stages limit time savings from additional staff. Costs include services and storage retention but exclude employer charges, general organisational overhead, tax, and figure preparation. Applied unit rates come from Google compute, disk, GPU, and storage/transfer pricing, and Claude token, cache, and search pricing. Salary levels and human-work estimates are planning assumptions.
Expanding the capacity for discovery
Across three unfamiliar assays, Prima Daedalus connects decisions about (bio)chemistry, counting, and biological meaning to executable workflows and published evidence, to build and assess the data to train and evaluate our BioAI foundation models. However, multi-agent workflows are expanding the capacity for discovery well beyond data generation.
At Prima Mente, we have built multi-agent loops for many applications. In ML research, our most advanced models are already highly automated with heavily guided auto-research workflows built upon biologically grounded evals58,59. Beyond that, our wet lab is transitioning towards an autonomous setting, where agentic solutions can support the design of experiments, execute them, make live decisions on the appropriate sample flow, and evaluate the experimental outcomes.
When carefully curated and supplemented with appropriate steering, multi-agent workflows provide an unparalleled opportunity. We already see a meaningful impact on bringing better treatments and diagnostics to patients sooner.
Author contributions
J.G. designed and implemented Prima Daedalus and conducted large-scale testing. F.M.M.-Z. reviewed the tool, performed secondary downstream analyses, prepared the figures, and drafted the manuscript. All authors contributed to the interpretation of the results and critically reviewed and revised the manuscript.
Acknowledgements
We thank the Union AI, Seqera, and Nebius teams for their support of our work through the backend infrastructure they provide for data processing and compute for model training and inference. We thank Ravi Solanki for the original idea, and Pooja Kathail, Qiurui (Rachel) Zeng, Pouya Niki, Georgie Ross, Florrie Christie, and Shabbir Khan for their kind feedback on the text. We are especially grateful to Hannah Madan, for her mentorship and support and her quietly making things happen behind the scenes, including organising this blog post and creating its banner, as well as to the rest of the Prima Mente team for their continued support.
Code availability
We will be releasing Prima Daedalus very soon, stay tuned!
Citation
@misc{ganbat_martinzamora_2026_daedalus,
  title        = {Automating training and ground truth data for BioAI models and evals},
  author       = {Ganbat, Javkhlan-Ochir and Mart{\'\i}n-Zamora, Francisco M.},
  year         = {2026},
  month        = {Sep},
  url          = {https://primamente.com/blog/prima-daedalus},
  organization = {Prima Mente}
}
Download the citation: BibTeX (.bib) RIS (.ris) EndNote (.enw) CSL-JSON (.json)
References
1. Luecken, M. D. et al. Defining and benchmarking open problems in single-cell analysis. Nat. Biotechnol. 43, 1035–1040 (2025). https://doi.org/10.1038/s41587-025-02694-w.
2. Patel, A. et al. DART-Eval: a comprehensive DNA language model evaluation benchmark on regulatory DNA. In Advances in Neural Information Processing Systems 37, 62024–62061 (2024). https://doi.org/10.52202/079017-1981.
3. Grešová, K., Martinek, V., Čechák, D., Šimeček, P. & Alexiou, P. Genomic benchmarks: a collection of datasets for genomic sequence classification. BMC Genom. Data 24, 25 (2023). https://doi.org/10.1186/s12863-023-01123-8.
4. Zhou, Z. et al. DNABERT-2: efficient foundation model and benchmark for multi-species genome. Preprint at https://doi.org/10.48550/arXiv.2306.15006 (2023).
5. Dalla-Torre, H. et al. Nucleotide Transformer: building and evaluating robust foundation models for human genomics. Nat. Methods 22, 287–297 (2025). https://doi.org/10.1038/s41592-024-02523-z.
6. Theodoris, C. V. et al. Transfer learning enables predictions in network biology. Nature 618, 616–624 (2023). https://doi.org/10.1038/s41586-023-06139-9.
7. Cui, H. et al. scGPT: toward building a foundation model for single-cell multi-omics using generative AI. Nat. Methods 21, 1470–1480 (2024). https://doi.org/10.1038/s41592-024-02201-0.
8. Pampari, A. et al. ChromBPNet: bias factorized, base-resolution deep learning models of chromatin accessibility reveal cis-regulatory sequence syntax, transcription factor footprints and regulatory variants. Preprint at https://doi.org/10.1101/2024.12.25.630221 (2024).
9. Jaganathan, K. et al. Predicting splicing from primary sequence with deep learning. Cell 176, 535–548.e24 (2019). https://doi.org/10.1016/j.cell.2018.12.015.
10. Jiang, S. et al. The landscape of single-cell foundation models: design principles, applications, and open challenges. Preprint at https://doi.org/10.20944/preprints202608.1166.v1 (2026).
11. Jiang, Q. et al. HoloCell: a generative foundation model for holistic cellular modeling. Preprint at https://doi.org/10.64898/2026.06.07.730684 (2026).
12. Avsec, Ž. et al. Advancing regulatory variant effect prediction with AlphaGenome. Nature 649, 1206–1218 (2026). https://doi.org/10.1038/s41586-025-10014-0.
13. Ji, B. et al. CAPTAIN: a multimodal foundation model pretrained on co-assayed single-cell RNA and protein. Nat. Commun. 17, 6161 (2026). https://doi.org/10.1038/s41467-026-72882-y.
14. Fu, X. et al. A foundation model of transcription across human cell types. Nature 637, 965–973 (2025). https://doi.org/10.1038/s41586-024-08391-z.
15. Bunne, C. et al. How to build the virtual cell with artificial intelligence: Priorities and opportunities. Cell 187, 7045–7063 (2024). https://doi.org/10.1016/j.cell.2024.11.015.
16. Cheng, X. et al. Harnessing AI to Build Virtual Cells. Preprint at https://doi.org/10.64898/2026.04.11.717183 (2026).
17. Zappia, L. et al. Feature selection methods affect the performance of scRNA-seq data integration and querying. Nat. Methods 22, 834–844 (2025). https://doi.org/10.1038/s41592-025-02624-3.
18. Wang, L., Zhang, C. & Zhang, S. Batch Effects Remain a Fundamental Barrier to Universal Embeddings in Single-Cell Foundation Models. Preprint at https://doi.org/10.64898/2025.12.19.695371 (2025).
19. Kömen, J. et al. Towards robust foundation models for digital pathology. Nat. Commun. 17, 5218 (2026). https://doi.org/10.1038/s41467-026-73923-2.
20. Swanson, K., Wu, W., Bulaong, N. L., Pak, J. E. & Zou, J. The Virtual Lab of AI agents designs new SARS-CoV-2 nanobodies. Nature 646, 716–723 (2025). https://doi.org/10.1038/s41586-025-09442-9.
21. Huang, K. et al. Autonomous biomedical research with an artificial intelligence agent. Science 393, eadz4351 (2026). https://doi.org/10.1126/science.adz4351.
22. Gottweis, J. et al. Accelerating scientific discovery with Co-Scientist. Nature 655, 487–496 (2026). https://doi.org/10.1038/s41586-026-10644-y.
23. Corpas, M. ClawBio: bioinformatics-native AI agent skill library (v0.5.0). Zenodo https://doi.org/10.5281/zenodo.19420648 (2026).
24. Miao, J., Davis, J. R., Zhang, Y., Pritchard, J. K. & Zou, J. Reimagining research papers as interactive and reliable AI agents. Nature https://doi.org/10.1038/s41586-026-11044-y (2026).
25. Ghareeb, A. E. et al. A multi-agent system for automating scientific discovery. Nature 655, 497–505 (2026). https://doi.org/10.1038/s41586-026-10652-y.
26. Zhang, H. G., Eckmann, P., Miao, J., Mahon, A. B. & Zou, J. The Virtual Biotech: a multi-agent AI framework for therapeutic discovery and development. Science https://doi.org/10.1126/science.aeg6779 (2026).
27. Ewels, P. A. et al. The nf-core framework for community-curated bioinformatics pipelines. Nat. Biotechnol. 38, 276–278 (2020). https://doi.org/10.1038/s41587-020-0439-x.
28. Avsec, Ž. et al. The Kipoi repository accelerates community exchange and reuse of predictive models for genomics. Nat. Biotechnol. 37, 592–600 (2019). https://doi.org/10.1038/s41587-019-0140-0.
29. Joglekar, A. et al. Single-cell long-read sequencing-based mapping reveals specialized splicing patterns in developing and adult mouse and human brain. Nat. Neurosci. 27, 1051–1063 (2024). https://doi.org/10.1038/s41593-024-01616-4.
30. Leung, S. K. et al. Full-length transcript sequencing of human and mouse cerebral cortex identifies widespread isoform diversity and alternative splicing. Cell Rep. 37, 110022 (2021). https://doi.org/10.1016/j.celrep.2021.110022.
31. Patowary, A. et al. Developmental isoform diversity in the human neocortex informs neuropsychiatric risk mechanisms. Science 384, eadh7688 (2024). https://doi.org/10.1126/science.adh7688.
32. Hutton, M. et al. Association of missense and 5′-splice-site mutations in tau with the inherited dementia FTDP-17. Nature 393, 702–705 (1998). https://doi.org/10.1038/31508.
33. D’Souza, I. et al. Missense and silent tau gene mutations cause frontotemporal dementia with parkinsonism-chromosome 17 type, by affecting multiple alternative RNA splicing regulatory elements. Proc. Natl Acad. Sci. USA 96, 5598–5603 (1999). https://doi.org/10.1073/pnas.96.10.5598.
34. Brown, A.-L. et al. TDP-43 loss and ALS-risk SNPs drive mis-splicing and depletion of UNC13A. Nature 603, 131–137 (2022). https://doi.org/10.1038/s41586-022-04436-3.
35. Klim, J. R. et al. ALS-implicated protein TDP-43 sustains levels of STMN2, a mediator of motor neuron growth and repair. Nat. Neurosci. 22, 167–179 (2019). https://doi.org/10.1038/s41593-018-0300-4.
36. Raj, T. et al. Integrative transcriptome analyses of the aging brain implicate altered splicing in Alzheimer’s disease susceptibility. Nat. Genet. 50, 1584–1592 (2018). https://doi.org/10.1038/s41588-018-0238-1.
37. Bai, B. et al. U1 small nuclear ribonucleoprotein complex and RNA splicing alterations in Alzheimer’s disease. Proc. Natl Acad. Sci. USA 110, 16562–16567 (2013). https://doi.org/10.1073/pnas.1310249110.
38. Shehadeh, L. A. et al. SRRM2, a potential blood biomarker revealing high alternative splicing in Parkinson’s disease. PLoS ONE 5, e9104 (2010). https://doi.org/10.1371/journal.pone.0009104.
39. Hardwick, S. A. et al. Single-nuclei isoform RNA sequencing unlocks barcoded exon connectivity in frozen brain tissue. Nat. Biotechnol. 40, 1082–1092 (2022). https://doi.org/10.1038/s41587-022-01231-3.
40. Belchikov, N. et al. A single-cell, long-read, isoform-resolved case-control study of FTD reveals cell-type-specific and broad splicing dysregulation in human brain. Cell Rep. 44, 116198 (2025). https://doi.org/10.1016/j.celrep.2025.116198.
41. Trull, A., Worthey, E. A. & Ianov, L. scnanoseq: an nf-core pipeline for Oxford Nanopore single-cell RNA-sequencing. Bioinformatics 41, btaf487 (2025). https://doi.org/10.1093/bioinformatics/btaf487.
42. You, Y. et al. Identification of cell barcodes from long-read single-cell RNA-seq with BLAZE. Genome Biol. 24, 66 (2023). https://doi.org/10.1186/s13059-023-02907-y.
43. McNeill, A. et al. SLC12A2 variants cause a neurodevelopmental disorder or cochleovestibular defect. Brain 143, 2380–2387 (2020). https://doi.org/10.1093/brain/awaa176.
44. Nicole, O. & Pacary, E. CaMKIIβ in neuronal development and plasticity: an emerging candidate in brain diseases. Int. J. Mol. Sci. 21, 7272 (2020). https://doi.org/10.3390/ijms21197272.
45. Montag-Sallaz, M., Schachner, M. & Montag, D. Misguided axonal projections, neural cell adhesion molecule 180 mRNA upregulation, and altered behavior in mice deficient for the close homolog of L1. Mol. Cell. Biol. 22, 7967–7981 (2002). https://doi.org/10.1128/MCB.22.22.7967-7981.2002.
46. Remnestål, J. et al. Altered levels of CSF proteins in patients with FTD, presymptomatic mutation carriers and non-carriers. Transl. Neurodegener. 9, 27 (2020). https://doi.org/10.1186/s40035-020-00198-y.
47. Niki, P. et al. Human whole-epigenome modelling for clinical applications with Pleiades. Preprint at https://doi.org/10.1101/2025.07.16.665231 (2025).
48. Wang, N. et al. Using interpretability to identify a novel class of biomarkers for Alzheimer’s detection. Goodfire and Prima Mente https://www.goodfire.com/research/interpretability-for-alzheimers-detection (2026).
49. Vorperian, S. K., Moufarrej, M. N., Tabula Sapiens Consortium & Quake, S. R. Cell types of origin of the cell-free transcriptome. Nat. Biotechnol. 40, 855–861 (2022). https://doi.org/10.1038/s41587-021-01188-9.
50. Toden, S. et al. Noninvasive characterization of Alzheimer’s disease by circulating, cell-free messenger RNA next-generation sequencing. Sci. Adv. 6, eabb1654 (2020). https://doi.org/10.1126/sciadv.abb1654.
51. Chen, S. et al. Cancer type classification using plasma cell-free RNAs derived from human and microbes. eLife 11, e75181 (2022). https://doi.org/10.7554/eLife.75181.
52. Chang, A. et al. Circulating cell-free RNA in blood as a host response biomarker for detection of tuberculosis. Nat. Commun. 15, 4949 (2024). https://doi.org/10.1038/s41467-024-49245-6.
53. Moufarrej, M. N. et al. Early prediction of preeclampsia in pregnancy with cell-free RNA. Nature 602, 689–694 (2022). https://doi.org/10.1038/s41586-022-04410-z.
54. nf-core. github.com/nf-core/rnaseq. Version 3.26.0. Zenodo https://doi.org/10.5281/zenodo.20072266 (2026).
55. Prajapati, H. K., Xu, Z., Eriksson, P. R. & Clark, D. J. Nucleosome dynamics render heterochromatin accessible in living human cells. Nat. Commun. 16, 4577 (2025). https://doi.org/10.1038/s41467-025-59994-7.
56. Garijo, D. et al. Quantifying reproducibility in computational biology: the case of the Tuberculosis Drugome. PLoS ONE 8, e80278 (2013). https://doi.org/10.1371/journal.pone.0080278.
57. Sanchis, P. et al. Analysis workflow of publicly available RNA-sequencing datasets. STAR Protoc. 2, 100478 (2021). https://doi.org/10.1016/j.xpro.2021.100478.
58. Lu, C. et al. The AI Scientist: towards fully automated open-ended scientific discovery. Preprint at https://doi.org/10.48550/arXiv.2408.06292 (2024).
59. Novikov, A. et al. AlphaEvolve: a coding agent for scientific and algorithmic discovery. Preprint at https://doi.org/10.48550/arXiv.2506.13131 (2025).