

Motivation
One of Prima Mente’s primary goals is to uncover novel biology for new therapeutic hypotheses for complex diseases, starting with those of the brain. In the brains of individuals with neurodegenerative conditions, many cells take on specific states that both recur and vary across patients, diseases, time, and studies. In our effort to understand, identify, and prioritise novel targets, we use these states as reference points, seeking perturbations (such as genetic or chemical interventions) that shift cells out of disease-associated states or toward protective ones. Experimentally characterizing many perturbations across cell states and in combinations is currently intractable, so predicting perturbation effects is a core modeling problem we seek to advance.
We learn to predict perturbation effects primarily from , since large perturbation experiments are usually only feasible in cultured cells1,2. These cells lack the tissue context of the brain and may not fully capture human disease biology3,4. These in vitro models may also activate different biological processes prior to a perturbation, causing the same intervention to have different effects across models. Therefore, understanding if and how perturbation effects measured using in vitro models translate to human biology is imperative to target discovery.
Here, we introduce In-Context Module discovery (ICM), a deep learning tool that learns from broad pretraining datasets to decompose cells into interpretable units called . ICM finds modules that correspond to known cell states. Importantly, by comparing how these modules shift across primary human tissue and in vitro cell models, ICM allows us to compare the realism of in vitro models. ICM makes it possible to link perturbation effects to the underlying biological processes active in each system. Together, these insights guide the selection of in vitro models and improve predictions of their behavior. Here, we focus on our initial cell of interest - the microglia, the resident immune cell of the brain, and RNA - the first modality of many we are modelling
Our approach to modeling RNA
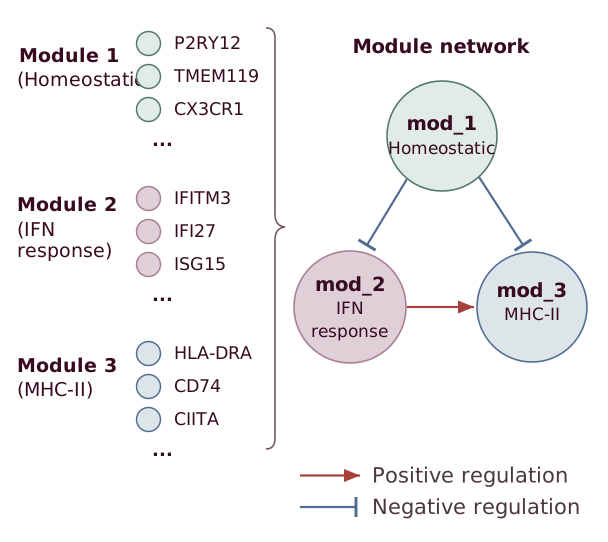
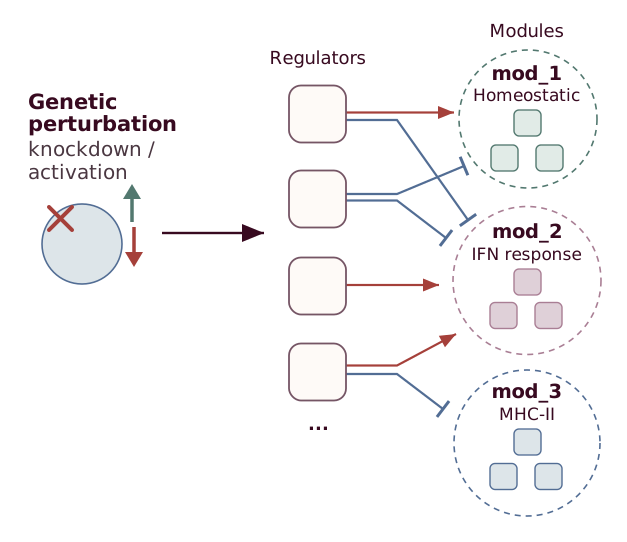
Single-cell RNA-sequencing (scRNA-seq) is one of the most widely utilised methods to generate biological data5. Although individual-gene measurements in scRNA-seq are often noisy and sparse6,7, coordinated variation across genes can reveal underlying biological processes. Instead of studying the cell at the individual gene level, we group genes whose expression varies together across cells into gene modules (Fig. 1a)8,9. Under this view, a cell’s gene expression profile can be decomposed into a weighted sum of its modules, allowing us to represent cell state by which modules are active in a particular cell, and those that are not. Because gene modules capture coordinated expression patterns that can reflect biological processes, we posit that they can help explain and predict perturbation effects based on which processes are active before treatment (Fig. 1b).
aGene modules as functional units
bPerturbations act on modules
cIn-context module updates
dTissues
Organ groups
Broad cell classes
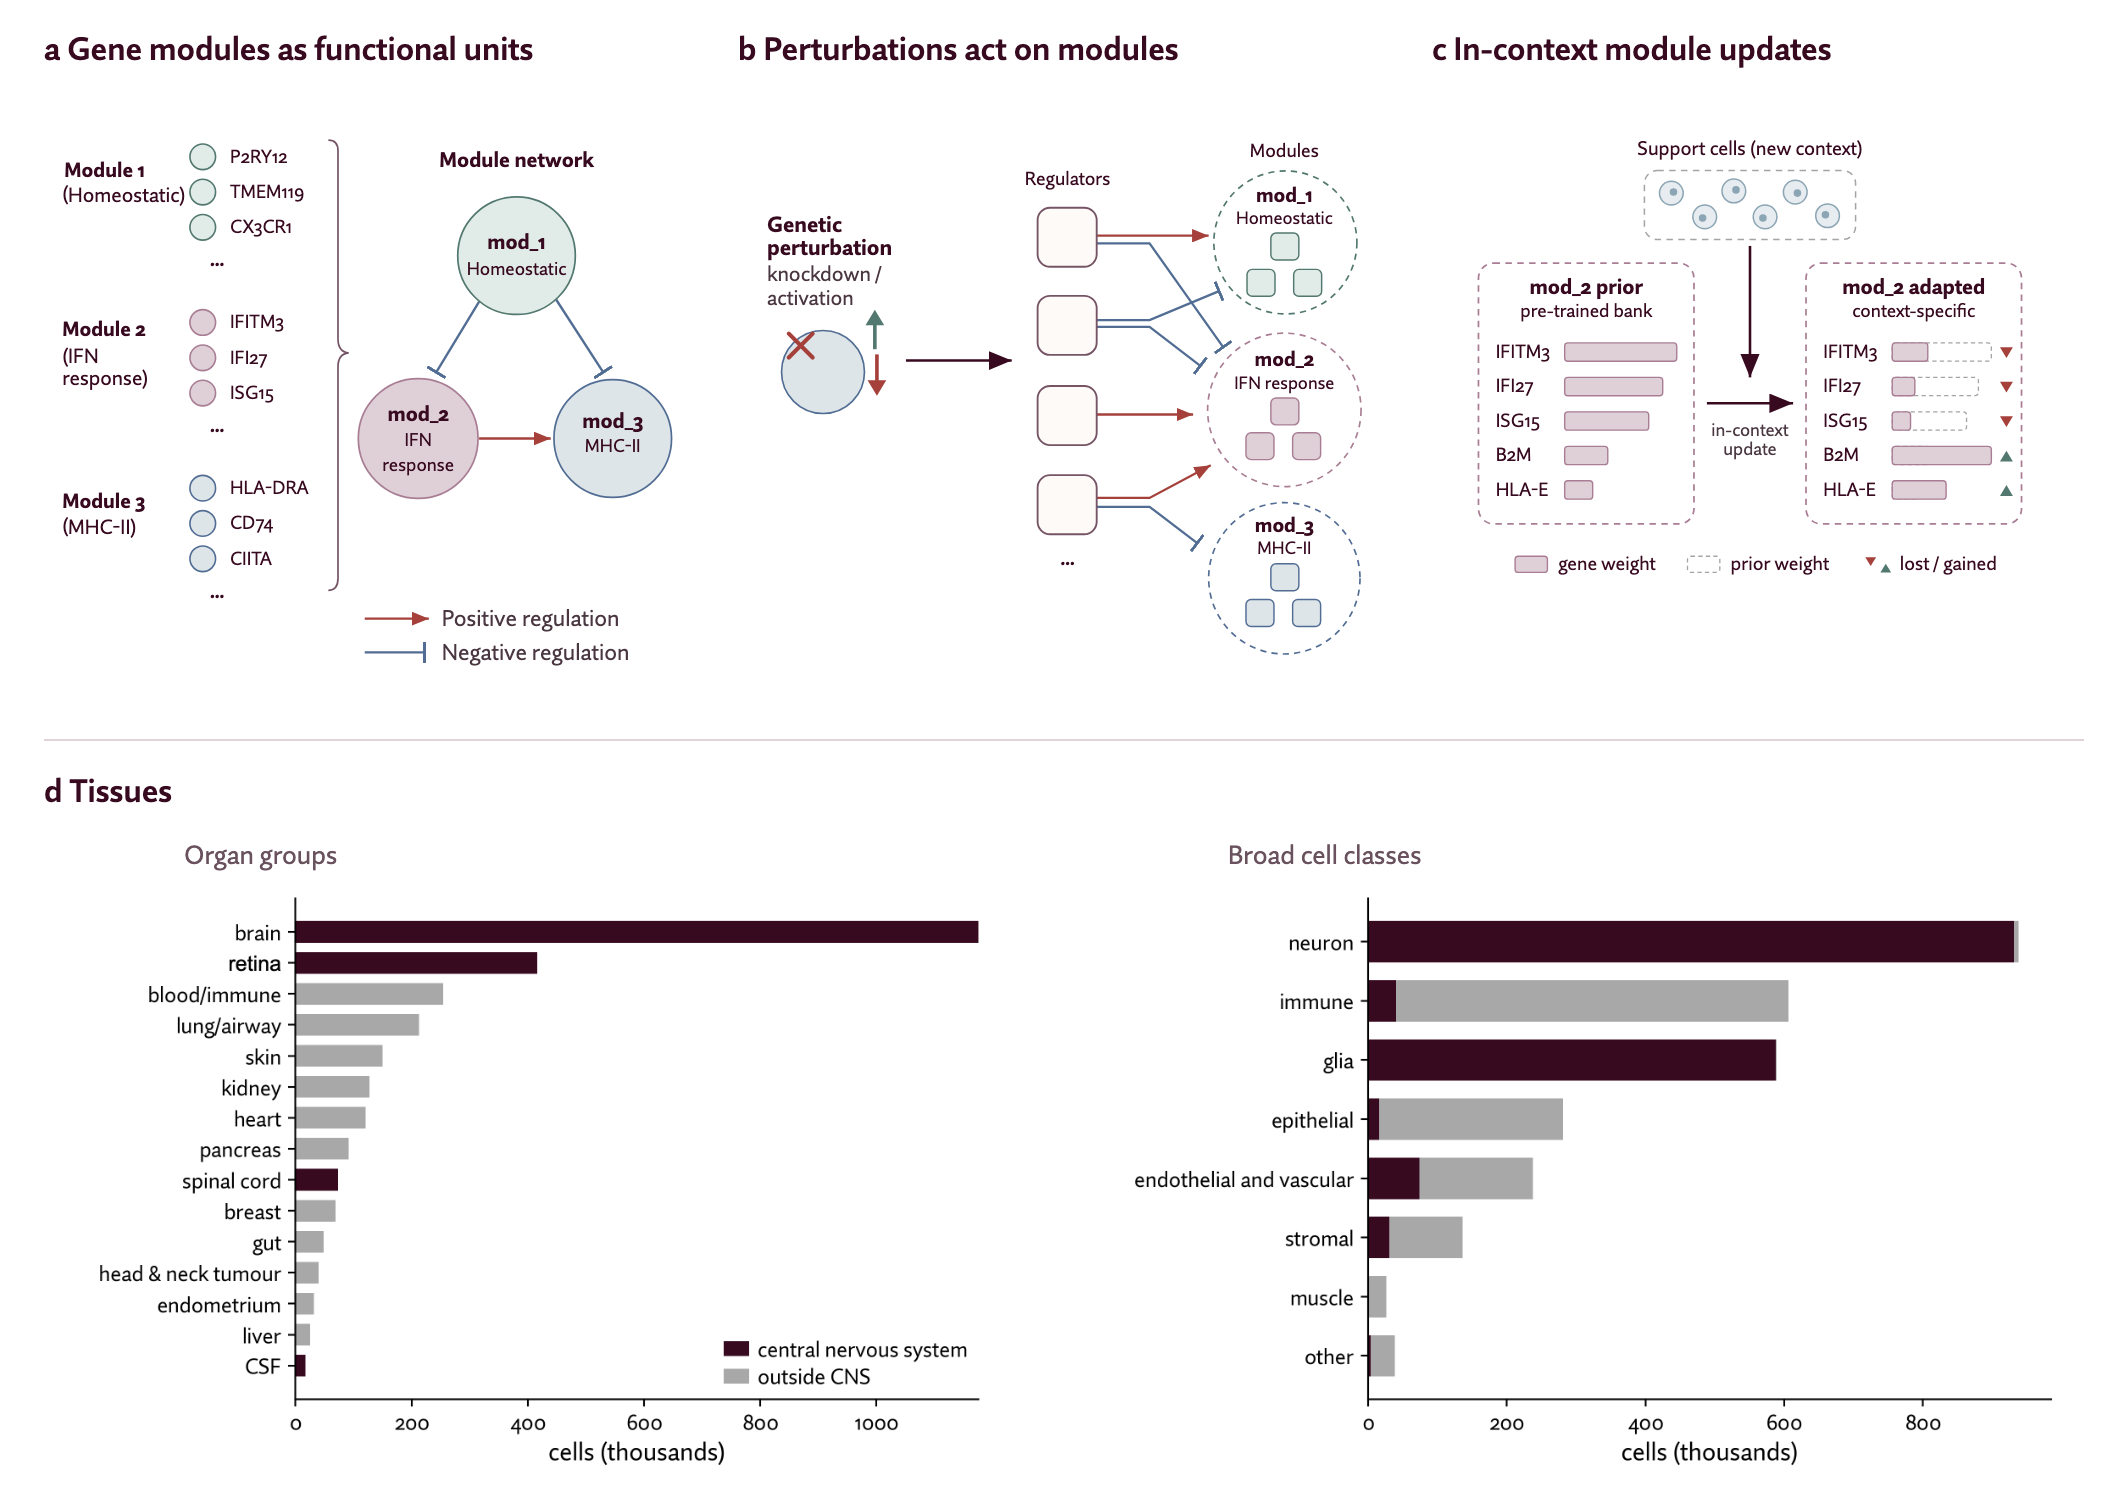
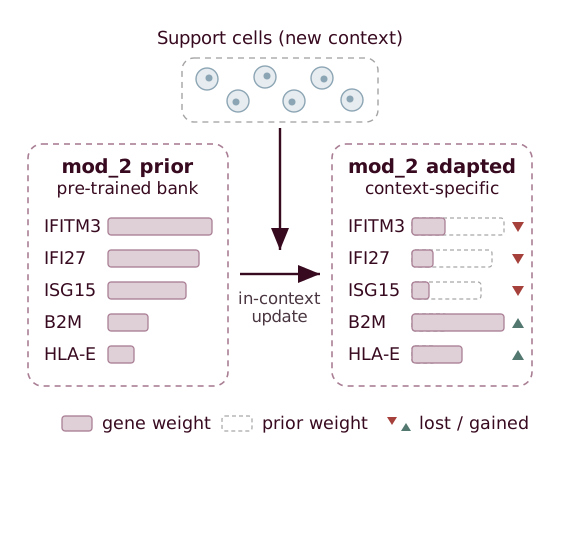
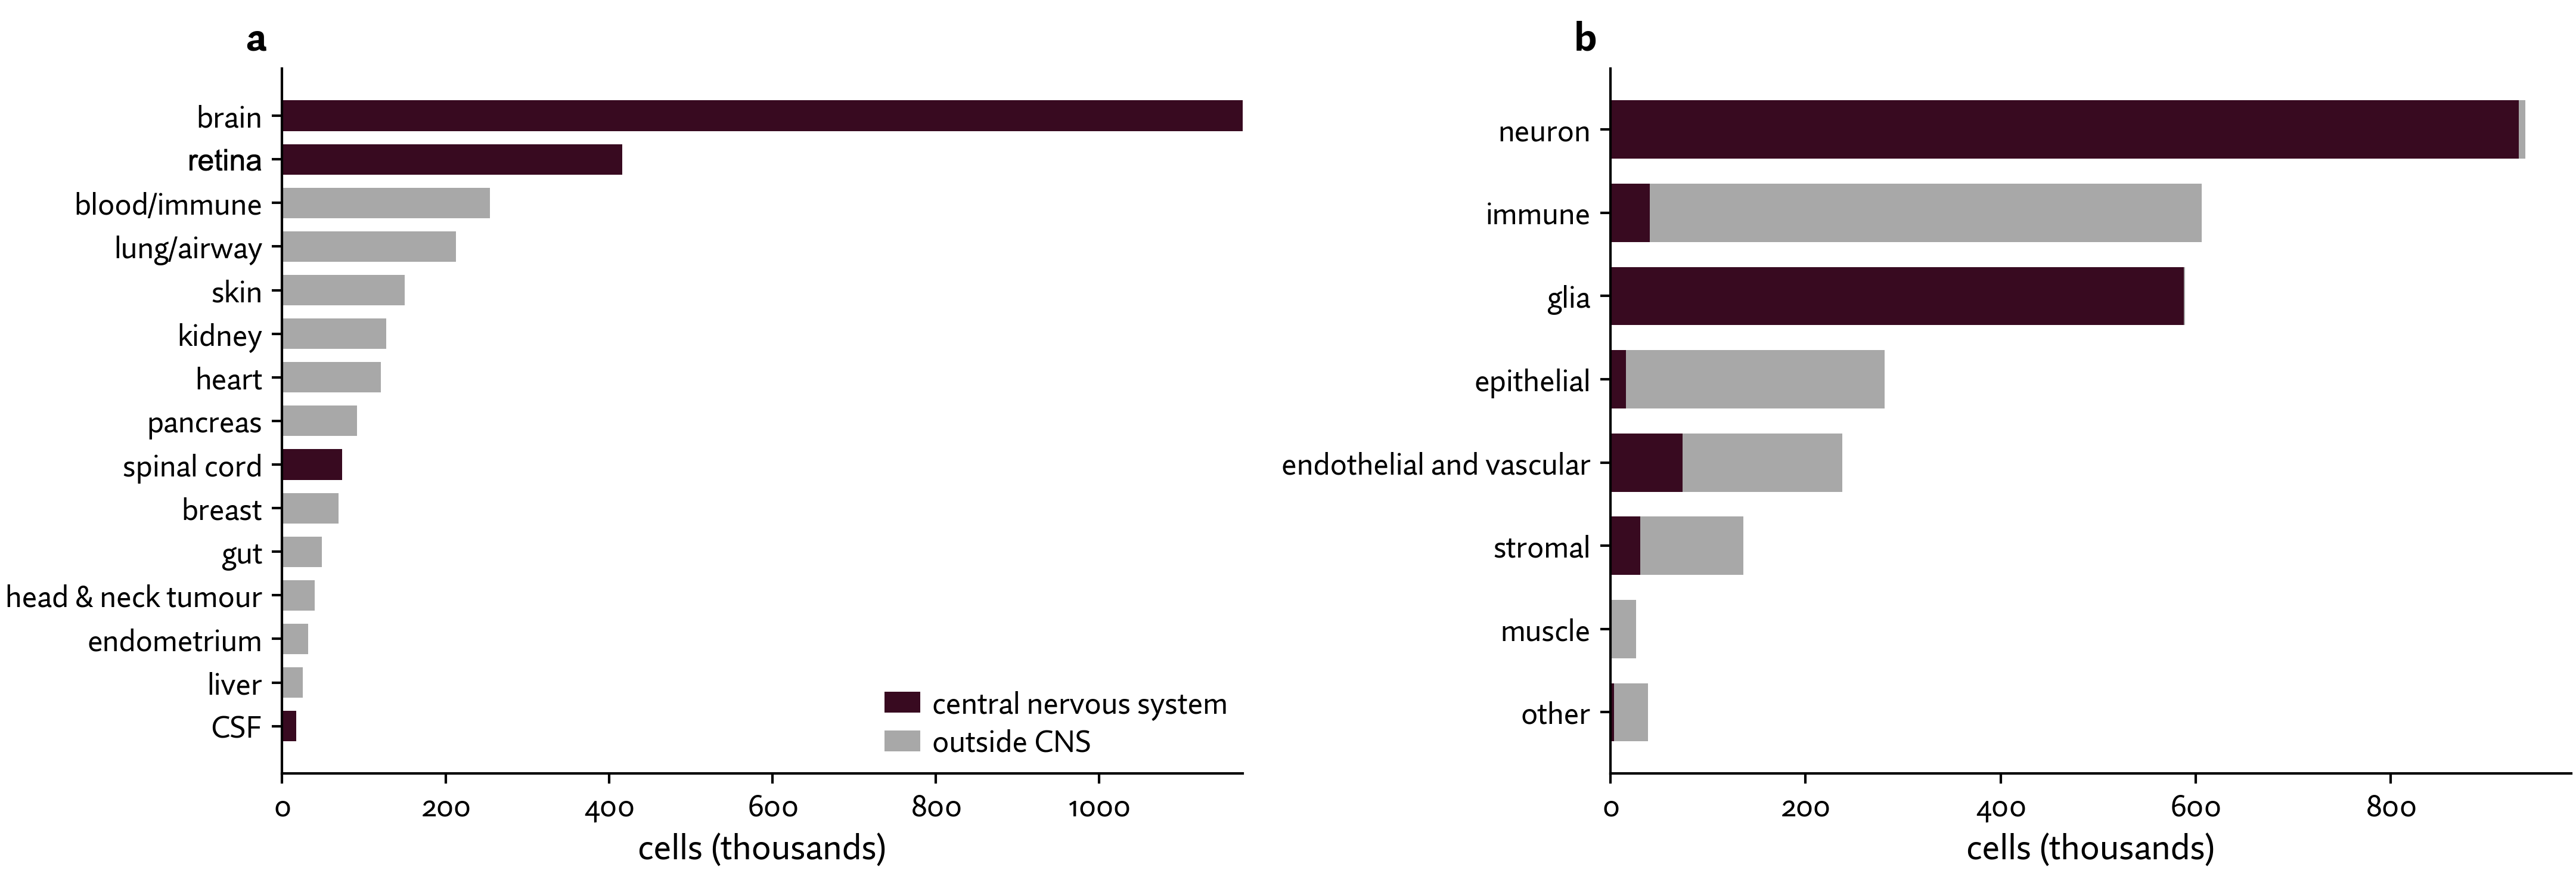
Figure 1. Gene modules provide a framework for understanding cellular function and perturbation effects. a, Genes with coordinated expression patterns can be grouped into modules associated with biological processes. Arrows illustrate potential relationships between modules, rather than interactions inferred by ICM. b, Genetic perturbations can alter module activity, leading to coordinated changes in gene expression. c, Support cells from a new dataset guide adjustments to the gene weights of pretrained modules, allowing them to capture context-specific expression patterns. d, ICM learns its shared module bank from a broad pretraining corpus. The corpus contains 2.85 million human cells from 66 datasets spanning diverse tissues and cell classes. Left, distribution of cells across organ groups (83 original tissue labels manually grouped); right, distribution across broad cell classes. Burgundy indicates central nervous system samples and grey indicates other tissues. The corpus also includes diseased and tumor tissue.
ICM learns a fixed set of gene modules once from a corpus of 2.85M human cells, and adapts the modules to each new dataset from a sample of the dataset's cells (Fig. 1c-d). We designed ICM to ensure modules are comparable: each adapted module remains linked to its pre-fit counterpart. They are also interpretable: explicit per-gene weights let us link module composition to biological processes.
Together, these properties let us examine which aspects of disease-associated cell states an in vitro model captures and how a perturbation alters their activity.
How ICM discovers and adapts modules
ICM works as follows (Fig. 2):
- Learn a shared bank of prior modules. ICM initializes a shared bank of gene modules using non-negative matrix factorization (NMF)10, then refines these modules during pretraining. Each module is represented by a set of non-negative per-gene weights. All datasets share this bank.
- Adapt prior modules to a new context. Support cells from a new context are summarized through per-gene expression statistics and gene–gene correlations. Iterative slot attention (ISA)11 uses this summary to compute a per-gene adjustment to each module in the pretrained prior bank. The prior bank itself is not updated.
- Describe query cells as combinations of modules. ICM reconstructs an unseen query cell's expression profile as a non-negative weighted sum of the adapted modules. The weight assigned to each module reflects its activity in that cell; we refer to these weights as module activities throughout this post.
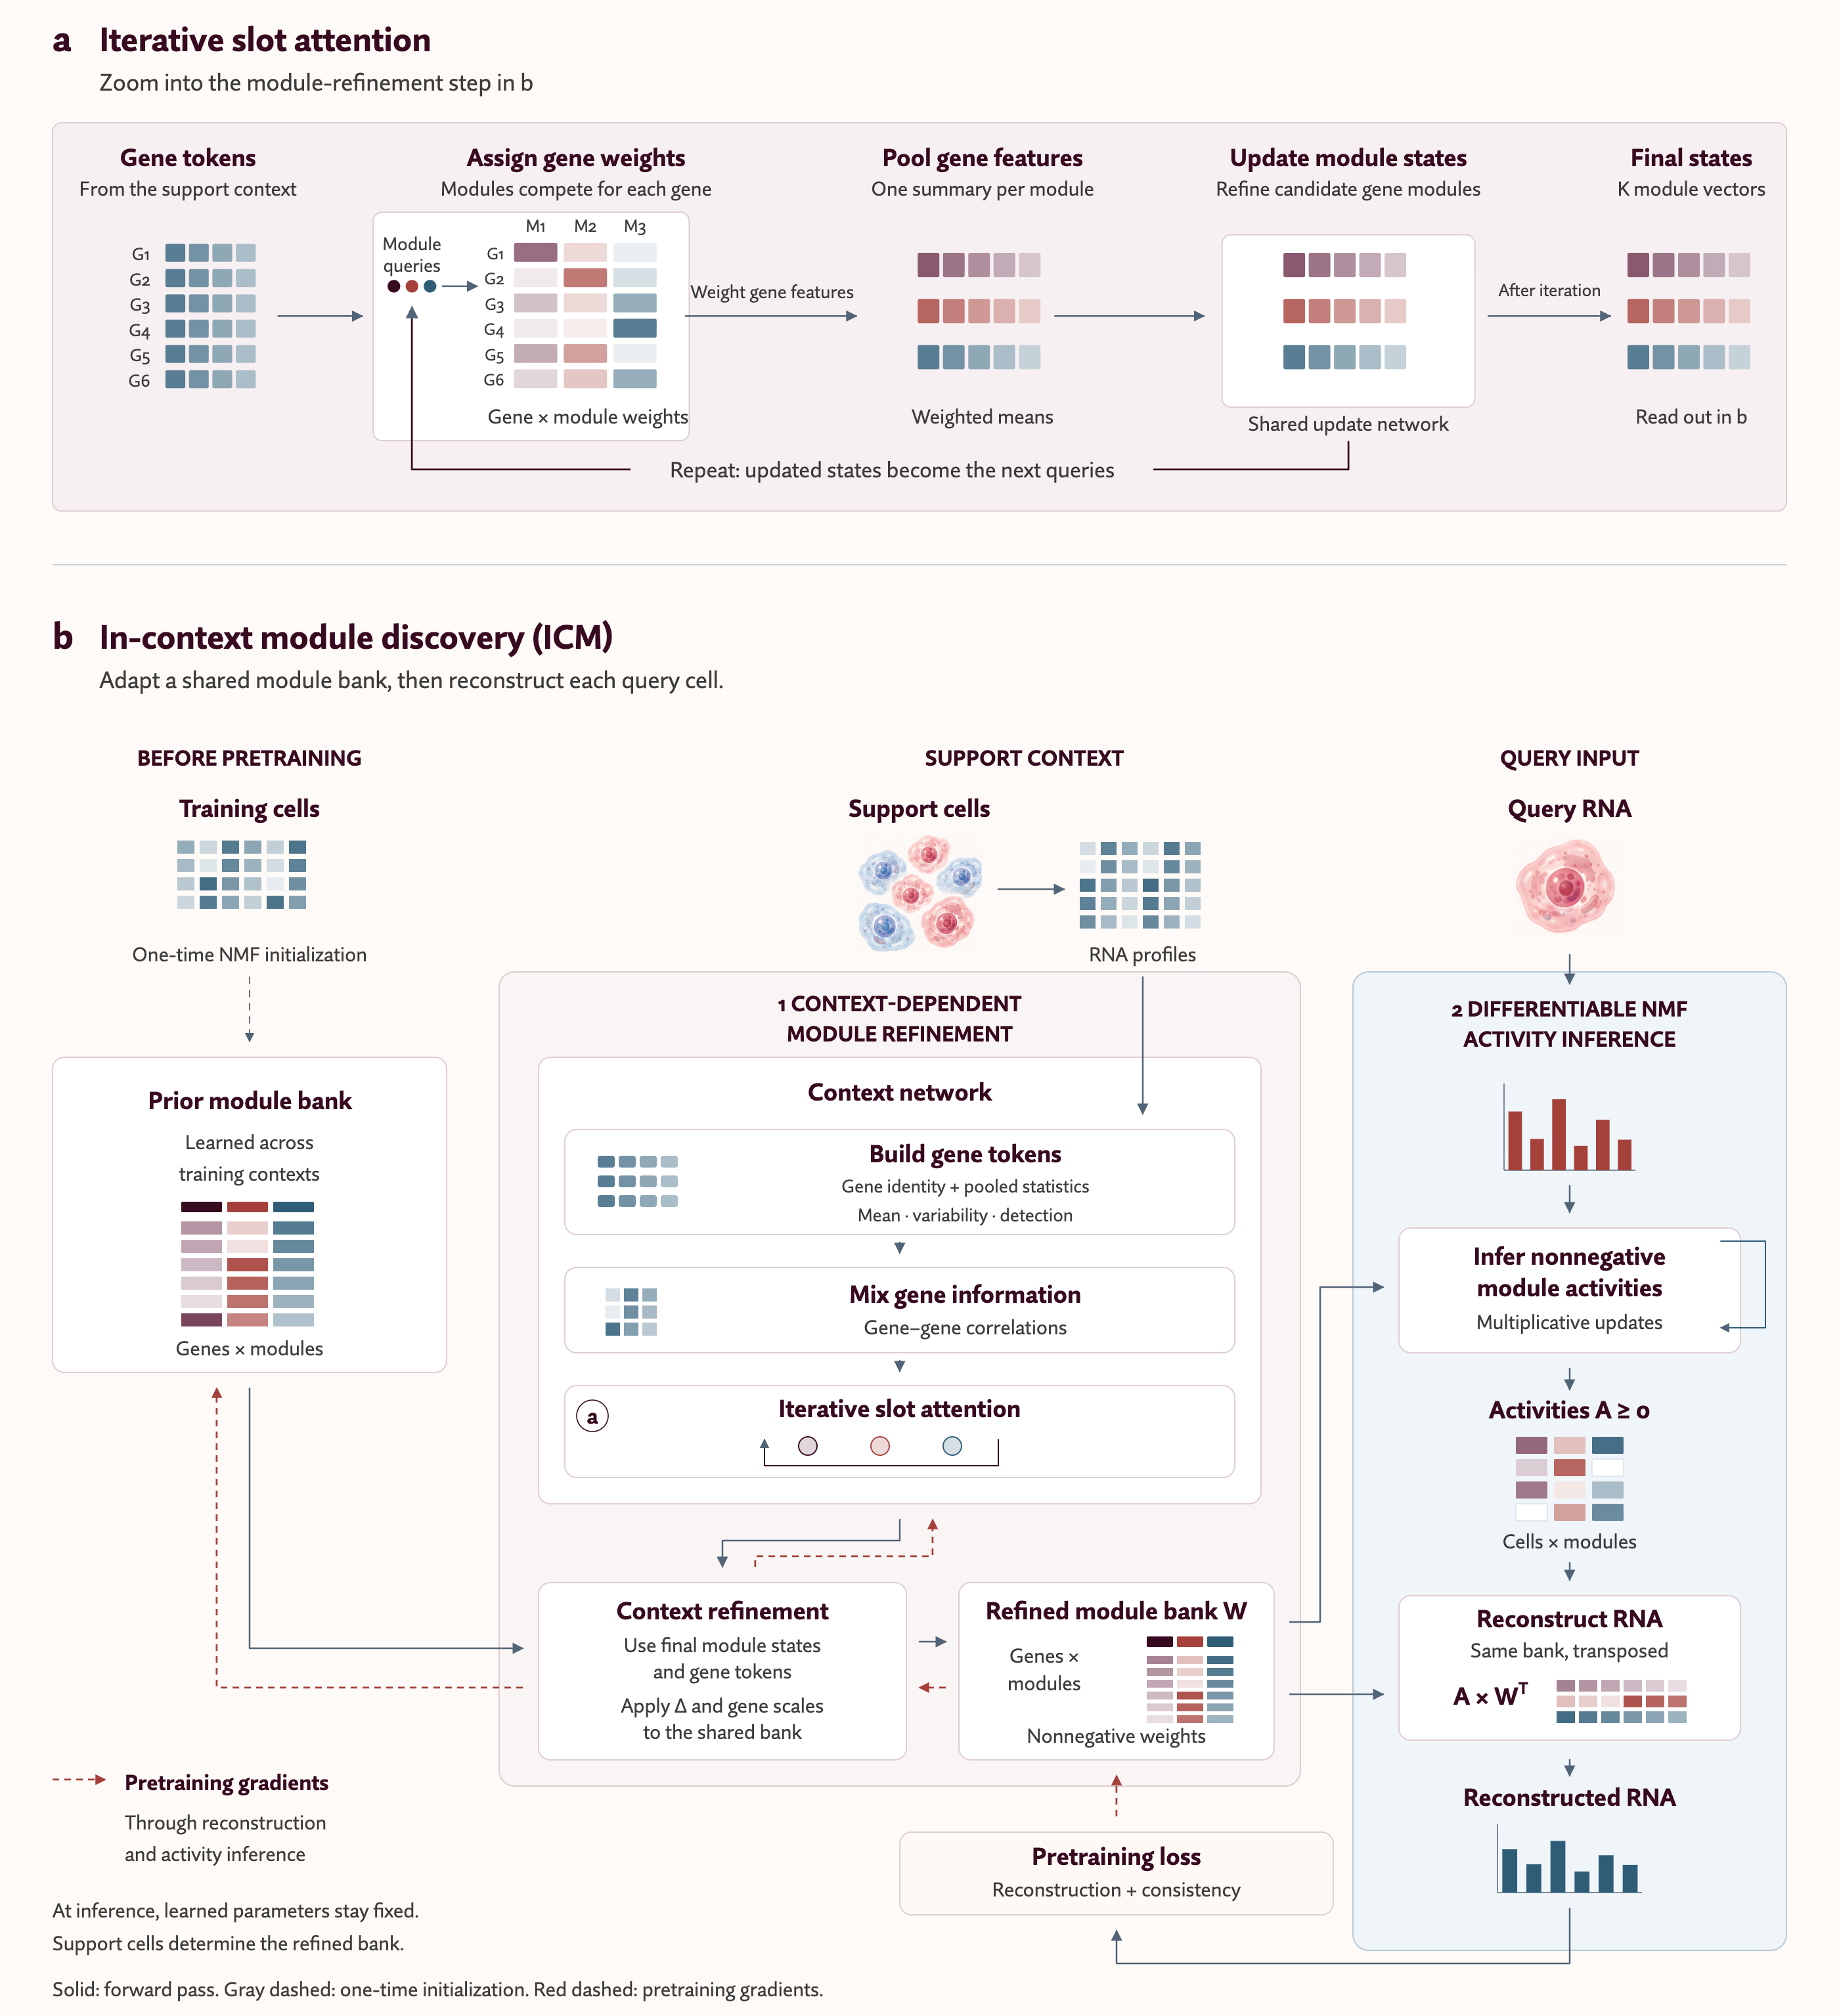
Figure 2. ICM adapts a prior module bank to new cellular contexts and infers module activities in individual cells. . ICM initializes a shared module bank using non-negative matrix factorization (NMF), then refines it during pretraining. For each new dataset, the context network uses expression statistics and gene–gene correlations from support cells to adjust the shared bank, producing context-specific module weights (W). The adapted bank remains fixed while NMF-based activity inference estimates non-negative module activities (A) for each query cell, reconstructing expression as AWᵀ. Solid arrows indicate forward computation, gray dashed arrows indicate one-time initialization, and red dashed arrows indicate pretraining gradients. Learned parameters remain fixed at inference.
Existing module decomposition methods make different trade-offs between adapting to a new dataset and keeping modules comparable (Fig. 3). NMF and cNMF learn a unique module set for each dataset, so module identities (e.g. mod_1) are not anchored across datasets9. Projection methods such as projectR and starCAT transfer fixed programs into new data, but they do not adapt to the new context-specific patterns12,13. LIGER, Spectra, and expiMap can capture dataset- or cell-type-specific patterns , but they do not combine a shared pretrained module bank with context-dependent gene-weight adaptation without retraining14,15,16. Stack also uses in-context learning to represent new cells without neural network weight updates, but its learned gene groupings are fixed after training and do not adapt to a new dataset’s co-expression patterns17. ICM is designed to combine context-specific adaptation with a shared, identifiable module bank.
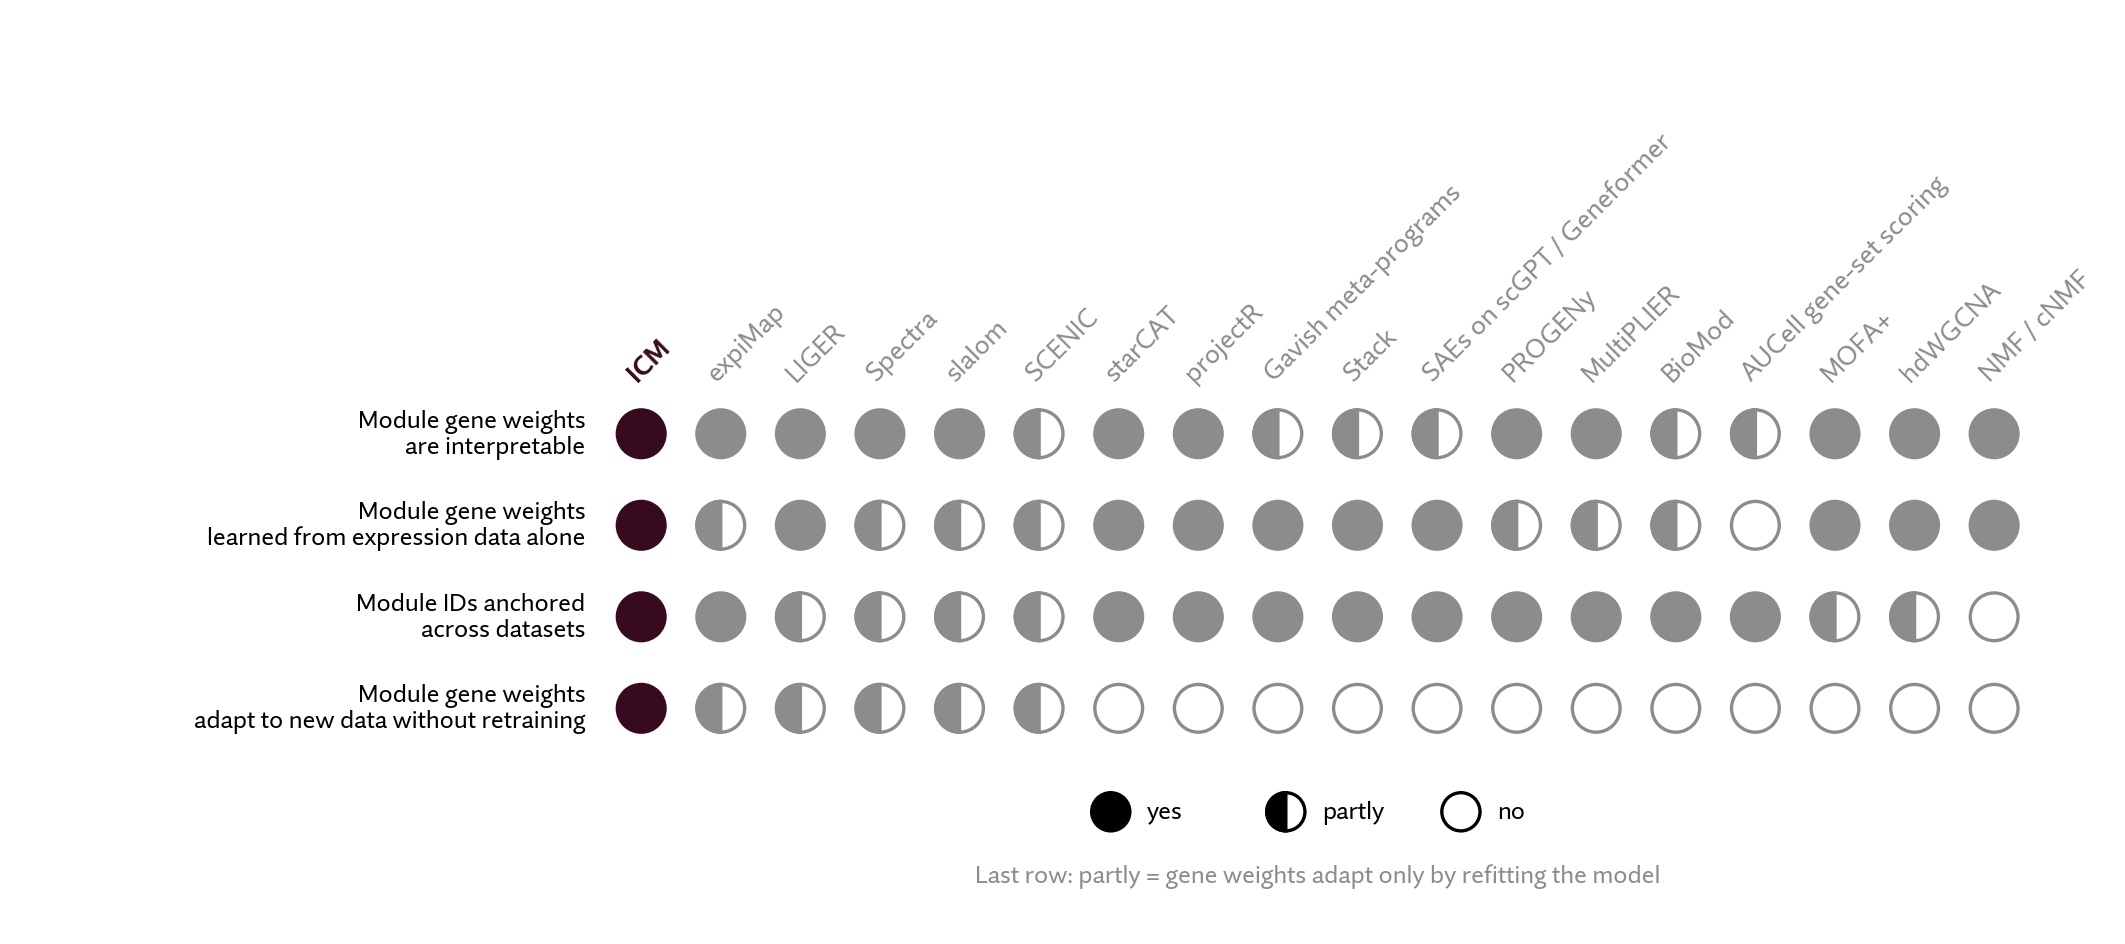
Figure 3. ICM combines interpretable gene modules, cross-dataset correspondence, and context-specific adaptation without retraining. We compare module detection methods (columns) across four properties: whether gene weights are interpretable, whether modules are learned from expression data alone, whether module identities remain anchored across datasets, and whether gene weights adapt to new data without retraining (rows). Filled, half-filled, and open circles indicate yes, partly, and no, respectively.
Methods compared: expiMap16, LIGER14, Spectra15, slalom18, SCENIC19, starCAT13, projectR12, Gavish meta-programs20, Stack17, SAEs on scGPT/Geneformer21, PROGENy22, MultiPLIER23, BioMod24, AUCell19, MOFA+25, hdWGCNA26, and NMF/cNMF9.
Comparing cell states across datasets requires modules that can accommodate local expression patterns while retaining a common reference. ICM achieves this using two components: a prior module bank learned during pretraining across populations, and a context network that adapts these modules to a reference population. Each adjusted module retains its position in the prior bank, allowing us to track its gene weights and cellular activities across datasets. In the next section, we test whether adapted modules preserve recognizable gene-weight patterns from their original counterparts.
During pretraining, ICM jointly learns the shared module bank and the context network across populations. NMF initializes the prior bank, after which backpropagation updates both the bank and the context network. The primary reconstruction objective encourages context-adapted modules to explain query-cell expression, while an auxiliary reconstruction objective keeps the shared bank useful independently of adaptation. A balancing term further discourages unused modules. At inference, the learned parameters remain fixed: reference cells determine the adapted module bank, and ICM fits module activities separately for each query cell.
To adapt the shared module bank to a new population, ICM uses reference cells to identify which genes vary together. The context encoder combines gene identity, expression statistics, and gene–gene correlations to create a representation of each gene. Iterative slot attention (ISA)11 then aggregates these representations into module states, repeatedly updating which genes contribute to each state. The context network uses these states to compute gene-level adjustments to the shared module bank, producing modules tailored to the reference population.
These adjustments determine each gene's membership across modules. ICM uses Sparsemax27 to produce a sparse gene–module membership matrix M, allowing some memberships to become exactly zero. This design decision forces the model to decisively allocate genes to modules, rather than having large modules with a long tail of low weighed genes. Positive gene-specific scaling factors then convert these memberships into a weighted module bank W, separating how a gene is distributed across modules from its overall contribution to expression. Once ICM has adapted the modules, it uses NMF-based activity inference9 to estimate each query cell's module activities by fitting a non-negative combination of the adapted modules to its observed RNA profile. Cells sharing a reference population therefore use the same adapted modules but can differ in their module activities.
Ablation results
For ICM to support meaningful comparisons across datasets, its modules must capture population-specific expression patterns while preserving their comparability to the prior module bank. We evaluate these properties separately, then test how slot attention contributes to maintaining them.
In summary:
- Context adaptation improves reconstruction of gene expression.
- Modules are comparable before and after fit.
- Slot attention improves module identity preservation.
We utilize these properties in the case study below.
Does context adaptation improve fit to expression?
Across 158 validation contexts, context adaptation reduced mean squared reconstruction error (MSE) by 27.6% and increased variance explained from 23.1% to 45.3%, with lower error in every context. We fitted cell activities separately for each bank, so this comparison tests the benefit of changing the modules themselves.
| Evaluation / metric | Context-adapted bank | Shared bank only |
|---|---|---|
| Validation: reconstruction MSE ↓ | 0.0575 | 0.0794 |
| Validation: variance explained ↑ | 45.3% | 23.1% |
| Held-out microglia: reconstruction MSE ↓ | 0.0520 | 0.0807 |
| Held-out microglia: variance explained ↑ | 48.9% | 20.2% |
| Held-out microglia: modules enriched for a Fumagalli state ↑ | 16.9% | 8.2% |
| Gene-list specificity ↑ | 68.21% | 66.16% |
Table A1. Context adaptation improves expression reconstruction and coverage of microglial state signatures. Comparison of the trained shared bank with its context-adapted version, with cell activities fitted separately for each bank. Validation results average 158 contexts; held-out microglia results cover 18 donors. Each evaluation uses three support samples and disjoint support and query cells. Enrichment tests overlap with five published microglial state signatures28. Gene-list specificity is the fraction of distinct genes in the pooled top-ten module lists that appear in exactly one list, evaluated across the validation contexts. Paired adapted-bank gains (95% Student-t CI) were: validation MSE reduction 0.02195 (0.02109–0.02282), variance explained +22.17 percentage points (21.01–23.33), and specificity +2.05 percentage points (1.88–2.21); held-out microglia MSE reduction 0.02875 (0.02567–0.03182) and variance explained +28.65 percentage points (26.09–31.21). Intervals use 158 context means or 18 donor means, each averaged across three support samples. Donor-level enrichment fractions were not saved, so the enrichment comparison is descriptive.
The same benefit extended to primary microglia from 18 donors held out of training in Tuddenham et al.29. Adaptation increased variance explained from 20.2% to 48.9%, and it also more than doubled the fraction of modules enriched for a Fumagalli microglial state signature, from 8.2% to 16.9%, with all five states represented in every adapted donor/support sample. Enrichment is akin to recall, while gene-list specificity tests whether modules specifically capture the pathway of interest or whether contain broad lists of highly annotated genes. The context-adapted bank achieves 68.21% from 66.16% in the shared bank (table A1).
This result connects the reconstruction objective to the state comparisons above: modules adjusted to the dataset-specific population can fit its expression more closely and capture more of its known state signatures.
Do modules maintain correspondence after context adaptation?
Our downstream analyses rely on comparing the same modules across datasets. However, better reconstruction would be less useful if adaptation changed modules so substantially that they no longer resembled their original counterparts. We therefore compared adapted modules with the shared bank using both their gene memberships (M) and their final weighted representations (W). Figure A1 brings the two comparisons together: panel a shows the relationship between adapted and prior modules in W for one context; panel b summarizes membership preservation in M across contexts.
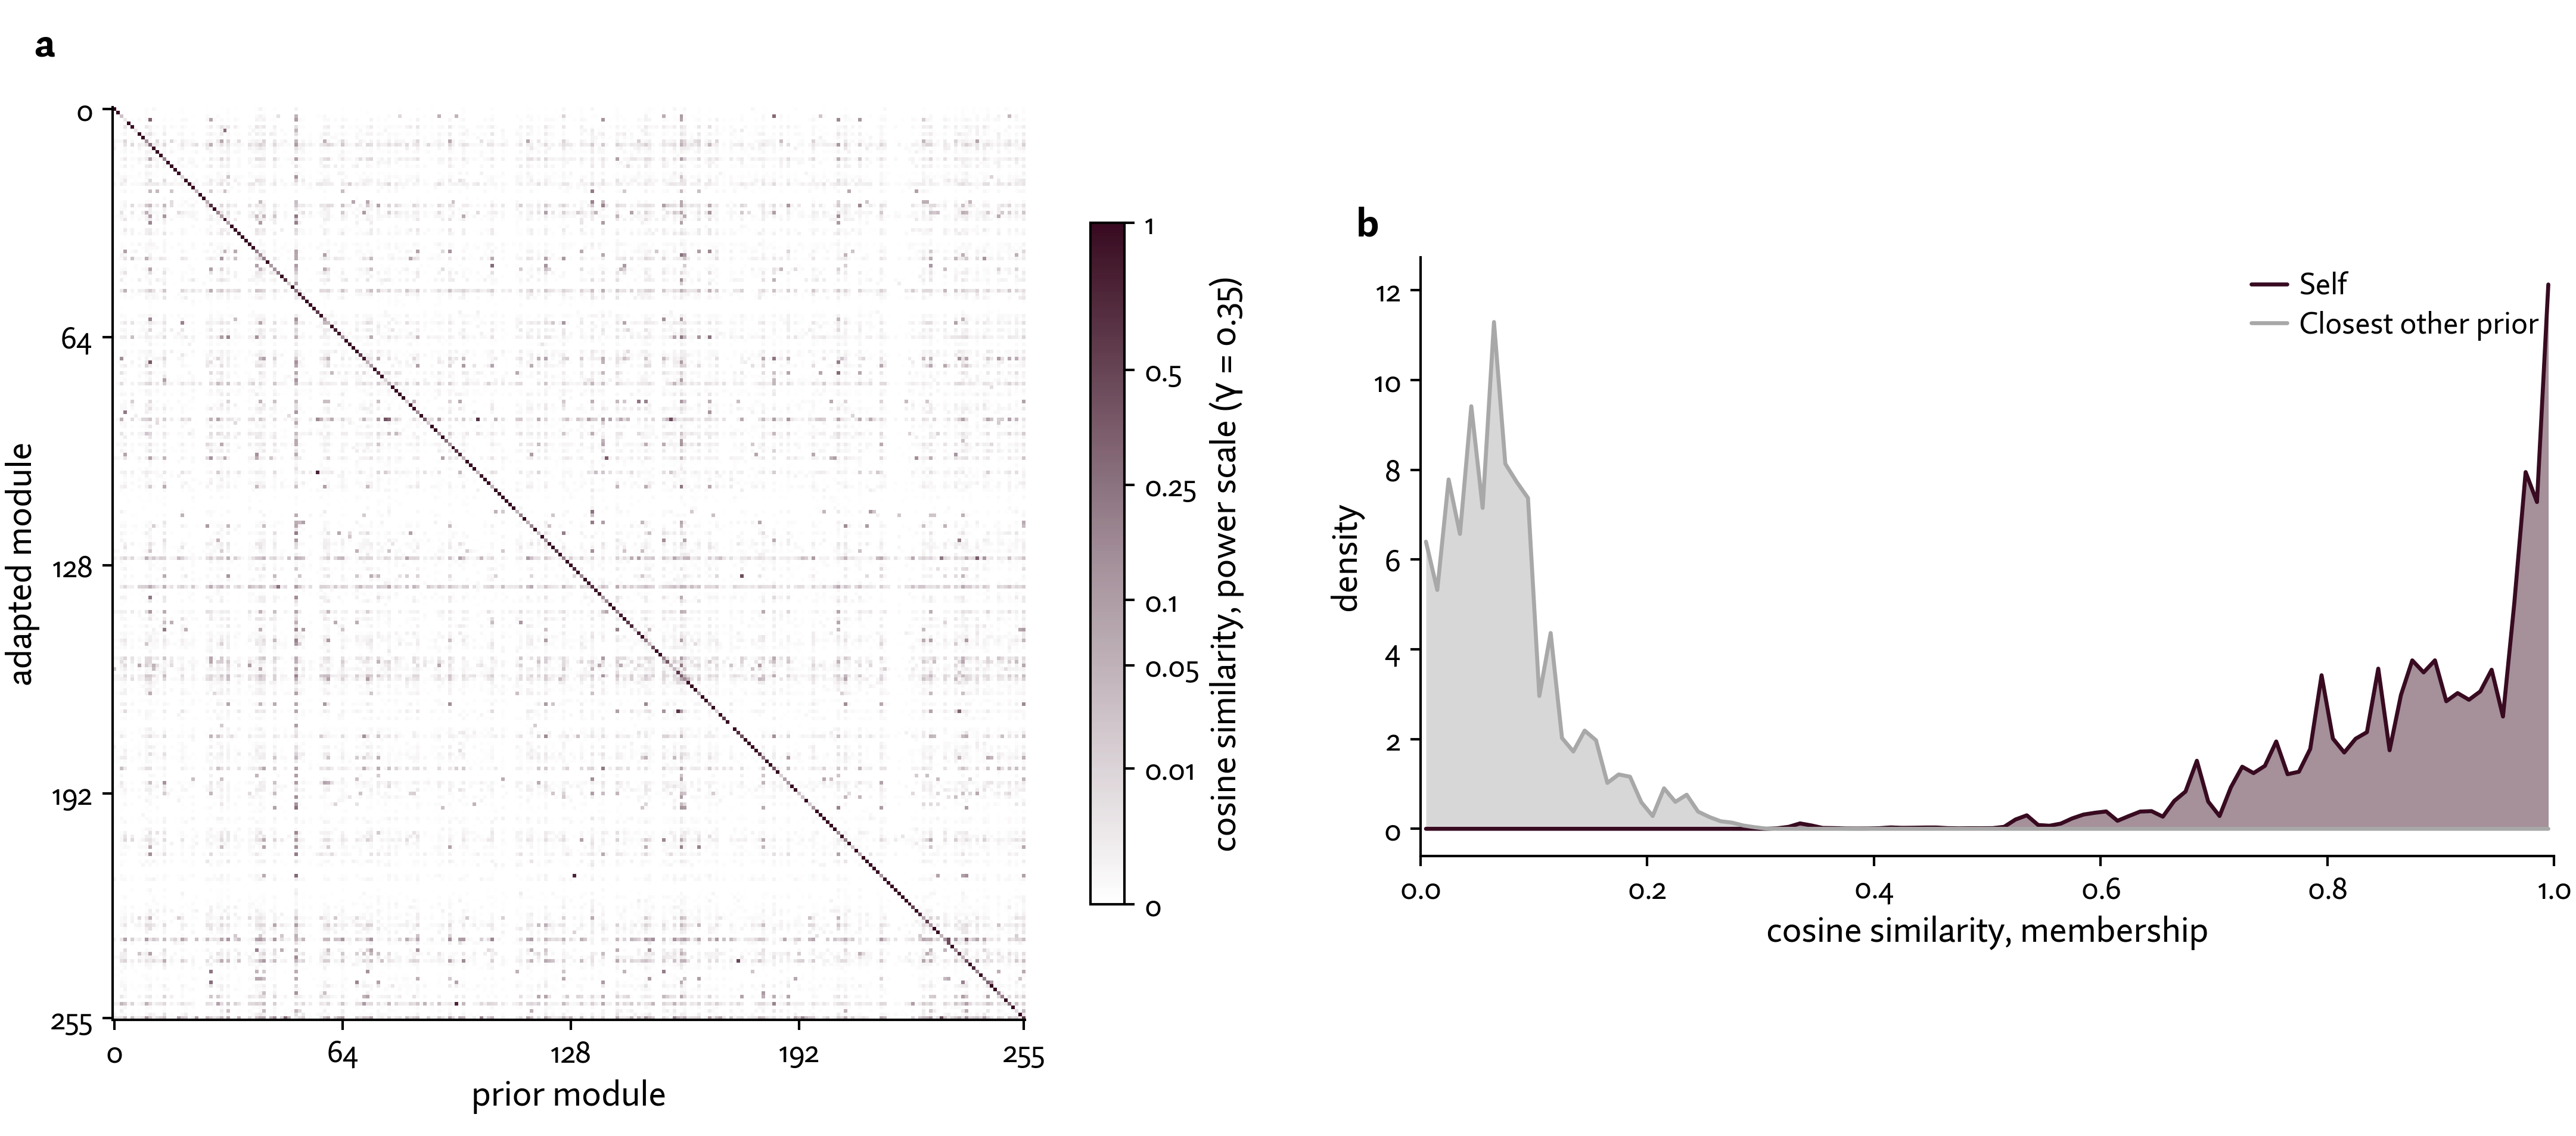
Figure A1. Context adaptation preserves recognizable module identities. a, Weighted module representations. The heatmap compares adapted modules (rows) with the prior module bank (columns) using cosine similarity between their weighted gene representations (W). The coloring uses a power scale γ=0.35 to intentionally highlight off-diagonal effects. Despite this, the prominent diagonal shows that adapted modules generally remain most similar to their original counterparts, rather than unrelated modules. This example uses a microglia dataset from Gerrits et al. (256 support cells)30. Panel a shows one context example; panel b evaluates comparability across validation contexts. b, Adapted gene memberships remain closest to their original prior module. Distributions of cosine similarity between each adapted module’s membership vector in M and its original shared-bank module (plum), or the closest different prior module (gray). Results cover 158 contexts, three support samples per context and 256 modules, yielding 121,344 dependent comparisons. The original module was the unique closest match in every comparison, with mean cosine similarity 0.879. This measures continuity of gene membership, rather than conservation of biological function.
Panel b quantifies the result across evaluated contexts: each adapted module’s membership vector in M remained closest to its own prior module. This continuity supports following modules across datasets. In the following microglia case study, we examine how these comparisons reveal conserved and context-specific biological features.
What does slot attention contribute to module comparability over self-attention?
Slot attention was chosen to enable module correspondence across contexts, but we wanted to compare to an alternative method: self-attention. To compare, we replaced the three slot-attention iterations and their readout with gene self-attention followed by a direct gene-to-module projection, keeping the context encoder, shared bank, and activity inference unchanged.
Both architectures preserved the closest prior match in the gene membership matrix M. However, slot attention preserved more original module identities in the final weighted bank under one-to-one matching. Reconstruction performance was similar, with self-attention achieving 0.7% lower validation MSE (Table A2). The benefits of slot attention outweigh the minor MSE improvement of self-attention. Slot attention also required 72.6% fewer refinement-component FLOPs per support set (2.645 versus 9.664 GFLOPs). This comparison counts matrix operations for one forward pass through the refinement component, rather than total model computation or measured runtime.
| Metric | Slots (3 iterations) | Self-attention + projection |
|---|---|---|
| Refinement-component parameters | 156,800 | 132,608 |
| Full-model parameters | 2.215M | 2.190M |
| Validation reconstruction MSE ↓ | 0.05746 | 0.05705 |
| Validation weighted module IDs retained ↑ | 91.1% | 84.2% |
| Component GFLOPs / support set ↓ | 2.645 | 9.664 |
| Fractional variance explained ↑ | 45.278% | 45.686% |
Table A2. Slot attention preserves more module identities with similar reconstruction accuracy and lower computational cost. Across 158 validation contexts, slot attention retained 91.1% of original weighted module identities compared with 84.2% for self-attention, a 6.9 percentage-point advantage. Both architectures achieved similar expression reconstruction, while slot attention used 72.6% fewer refinement-component FLOPs despite having slightly more parameters. FLOPs measure matrix operations for one forward pass per support set, not total model computation. Across seven held-out studies (Fig. A2), the paired slots-minus-self-attention difference was 4.77 percentage points for module IDs retained (95% CI 3.20–6.34) and 0.00019 for MSE (95% CI −0.00020–0.00058). These study-level intervals do not capture training-run variability; each architecture was trained once. Parameter counts and calculated FLOPs are deterministic. Bold values indicate the better result for each metric; parameter counts are descriptive and are not ranked.
To test whether this pattern extended beyond the validation contexts, we compared the same frozen checkpoints across seven studies excluded from pretraining. Both models received the same support and query cells. Slot attention retained more weighted module IDs in every study mean (Fig. A2a). In all six studies with at least five donors, the paired 95% confidence interval supported higher retention with slot attention.
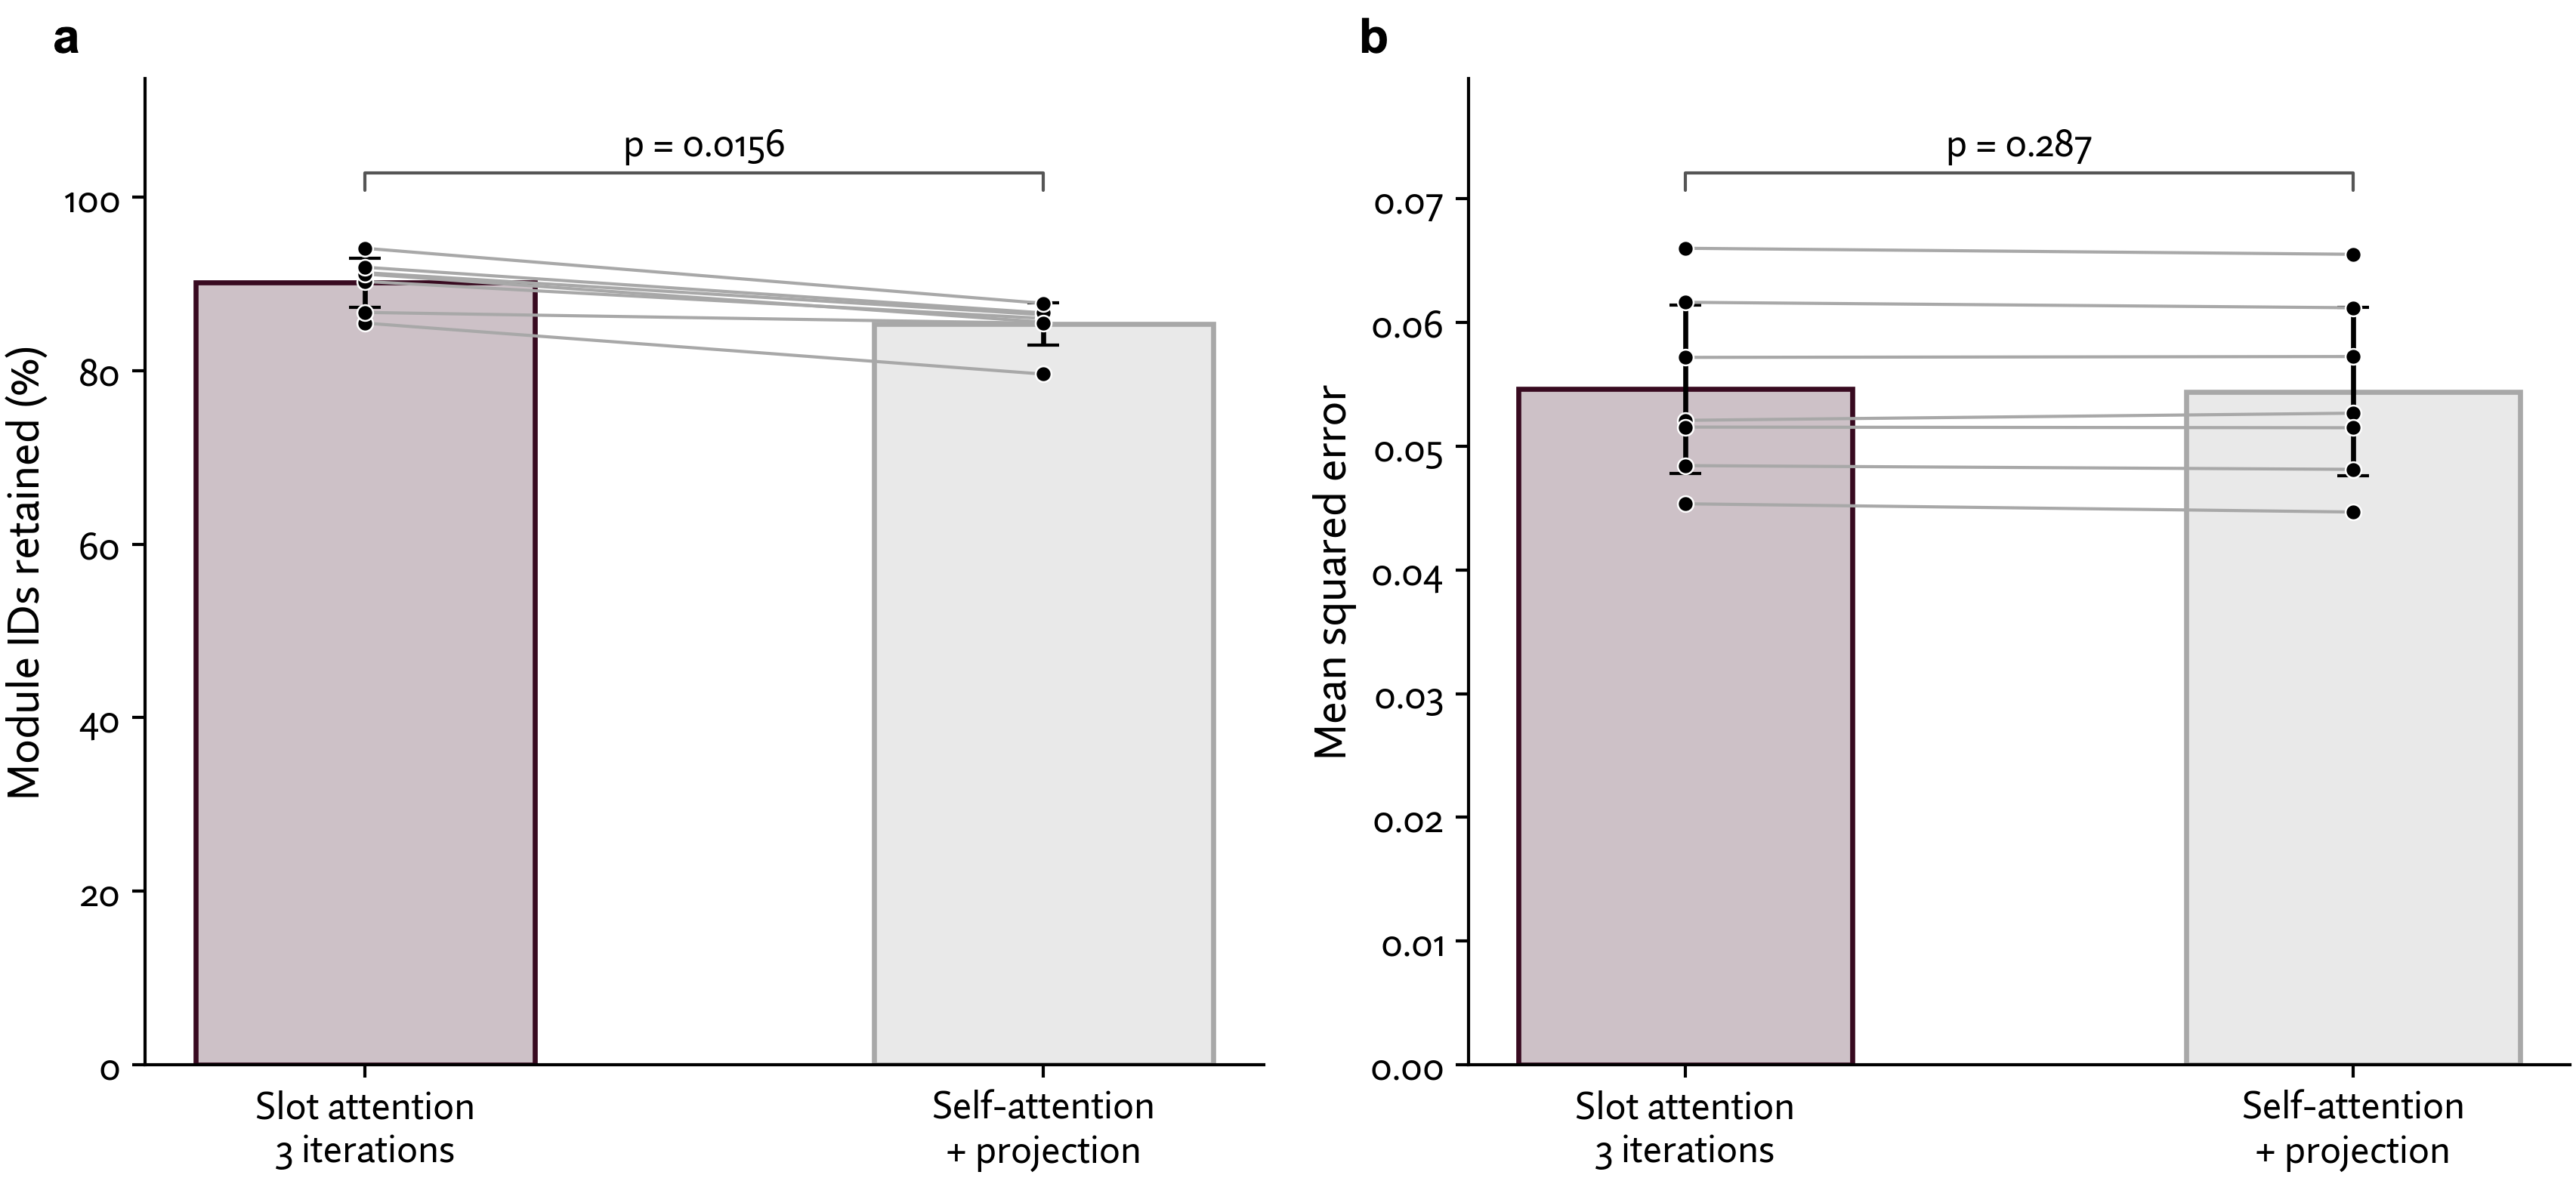
Figure A2 Slot attention preserves more module identities across held-out studies. a. Slot attention achieved higher mean retention in all seven studies, with an average advantage of approximately 4.8 percentage points (two-sided exact paired sign test, p = 0.0156). Bars show study means with Student-t confidence intervals, while connected dots show paired study results. b. Slot attention and self-attention achieve similar reconstruction performance across the same held-out studies. Bars show the equally weighted mean MSE across seven studies, with 95% Student-t confidence intervals. Connected dots show paired study means. The overall paired comparison found no statistically significant difference (two-sided paired t-test, p = 0.287; df = 6).
Across the same seven studies, both architectures achieved similar overall reconstruction performance, with no statistically significant difference in MSE (paired p = 0.287; Fig. A2b).
ICM identifies biologically meaningful modules and reveals unexpected features of in vitro microglia
To quantify how well our learned modules capture real functional relationships between genes, we tested ICM on microglia, the brain’s resident immune cells, using data from primary human microglia and in vitro models. Here, we show that ICM:
- Recovers known microglia states: In every dataset, ICM finds modules matching all six well-described microglial states, even though the modules were learned without these states as labels.
- Groups genes by a shared regulator: ICM finds a module enriched for genes bound by STAT2, a regulator of the interferon (antiviral) response which is enriched in every dataset. So the modules can capture genes that are co-regulated, not simply co-expressed.
- Reveals unexpected features of in vitro microglia: ICM finds that a subset of in vitro microglia express genes typical of dendritic cells, a different immune cell type. We treat this as a hypothesis for follow-up experiments.
- Explains why a perturbation behaves differently across contexts: Reducing STAT2 strongly shifted gene expression one in vitro model but barely moved another. The STAT2-associated module shows why: low baseline module activity results in minimal perturbation responses, even for highly-effective target knockdowns.
Background: How we define ground truth microglial states
Microglia are the first cell Prima Mente's cell modelling efforts have focussed on. As the brain's resident immune cells, they clear cellular debris, respond to pathogens, and help regulate synapses and inflammatory signaling31. Research implicates microglia in neuroinflammatory and neurodegenerative diseases32,33,34, links them to genetic risk for dementia35,36,37, and identifies early changes as markers of neurodegeneration38,39,40. Across a spectrum of disease and stress conditions, microglia exhibit recurring states associated with biological processes such as phagocytosis and cytokine signaling28,41.
As large perturbation screens are difficult to perform in primary microglia, researchers often use microglia-like cells derived from induced pluripotent stem cells (iPSCs)2,42. However, these models do not necessarily reproduce the biology of microglia in the human brain. Microglial identity depends upon the brain environment, and primary microglia rapidly lose characteristic gene expression patterns in cell culture3,4. Different iPSC differentiation methods also produce different mixtures of baseline cell states, and the same perturbation can produce different responses across models42. Mapping cells to known microglial states therefore provides a common reference for comparing models and understanding their responses to perturbations2,42.
To establish a consistent reference for these comparisons, we use a common reference of microglial states as defined by Fumagalli et al.28. By synthesizing studies across species and experimental contexts, the group identified five recurring states, each characterized by a set of marker genes:
- Homeostatic: markers of microglia identity and resting state
- Disease-associated microglia (DAM): an activation state associated with neurodegeneration and TREM2 signaling.
- Cytokine-responsive microglia (CRM): an activation state associated with cytokine signaling and inflammation.
- Interferon-responsive microglia (IFN): an activation state marked by interferon-stimulated genes.
- MHC-II: an activation state with high expression of MHC class II and other antigen-presentation genes.
We add a sixth, Cycling, using the G2/M gene signature from Tirosh et al.43 to capture a proliferative microglial state observed in vivo. Together, these six signatures provide a common reference for evaluating ICM modules across primary, xenograft, and iPSC-derived microglia.
Comparing primary human microglia with iPSC-derived models
To evaluate which of these six microglial states are present across experimental contexts, we chose four datasets that span a range from primary human microglia to in vitro models.
- Primary: Microglia isolated from fresh brain tissue of donors with neurodegenerative disease, representing a cross-disease human microglia resource29.
- Xenograft: iPSC-derived microglia transplanted into mouse brains, allowing the cells to develop fully in a brain microenvironment44.
- iPSC-derived perturbations: Two microglia differentiation protocols used by McQuade et al. in the same CRISPRi screen, enabling us to compare perturbation responses across models42:
In the figures below, the datasets are simply labelled by model context: Primary, Xenograft, iMG and iTF.
ICM-derived modules enrich for known microglial states and established regulatory networks
We first asked whether ICM recovers the six reference microglial states across our four datasets. All six state signatures were enriched in at least one module in each dataset, and several modules consistently matched the same state across all four datasets (Fig. 4). These results suggest that ICM can effectively identify consensus cell states. To do this, we used over-representation analysis (ORA) to test whether a module’s highest-weighted genes overlap with the six conserved microglia state signatures more than expected by chance46,47.
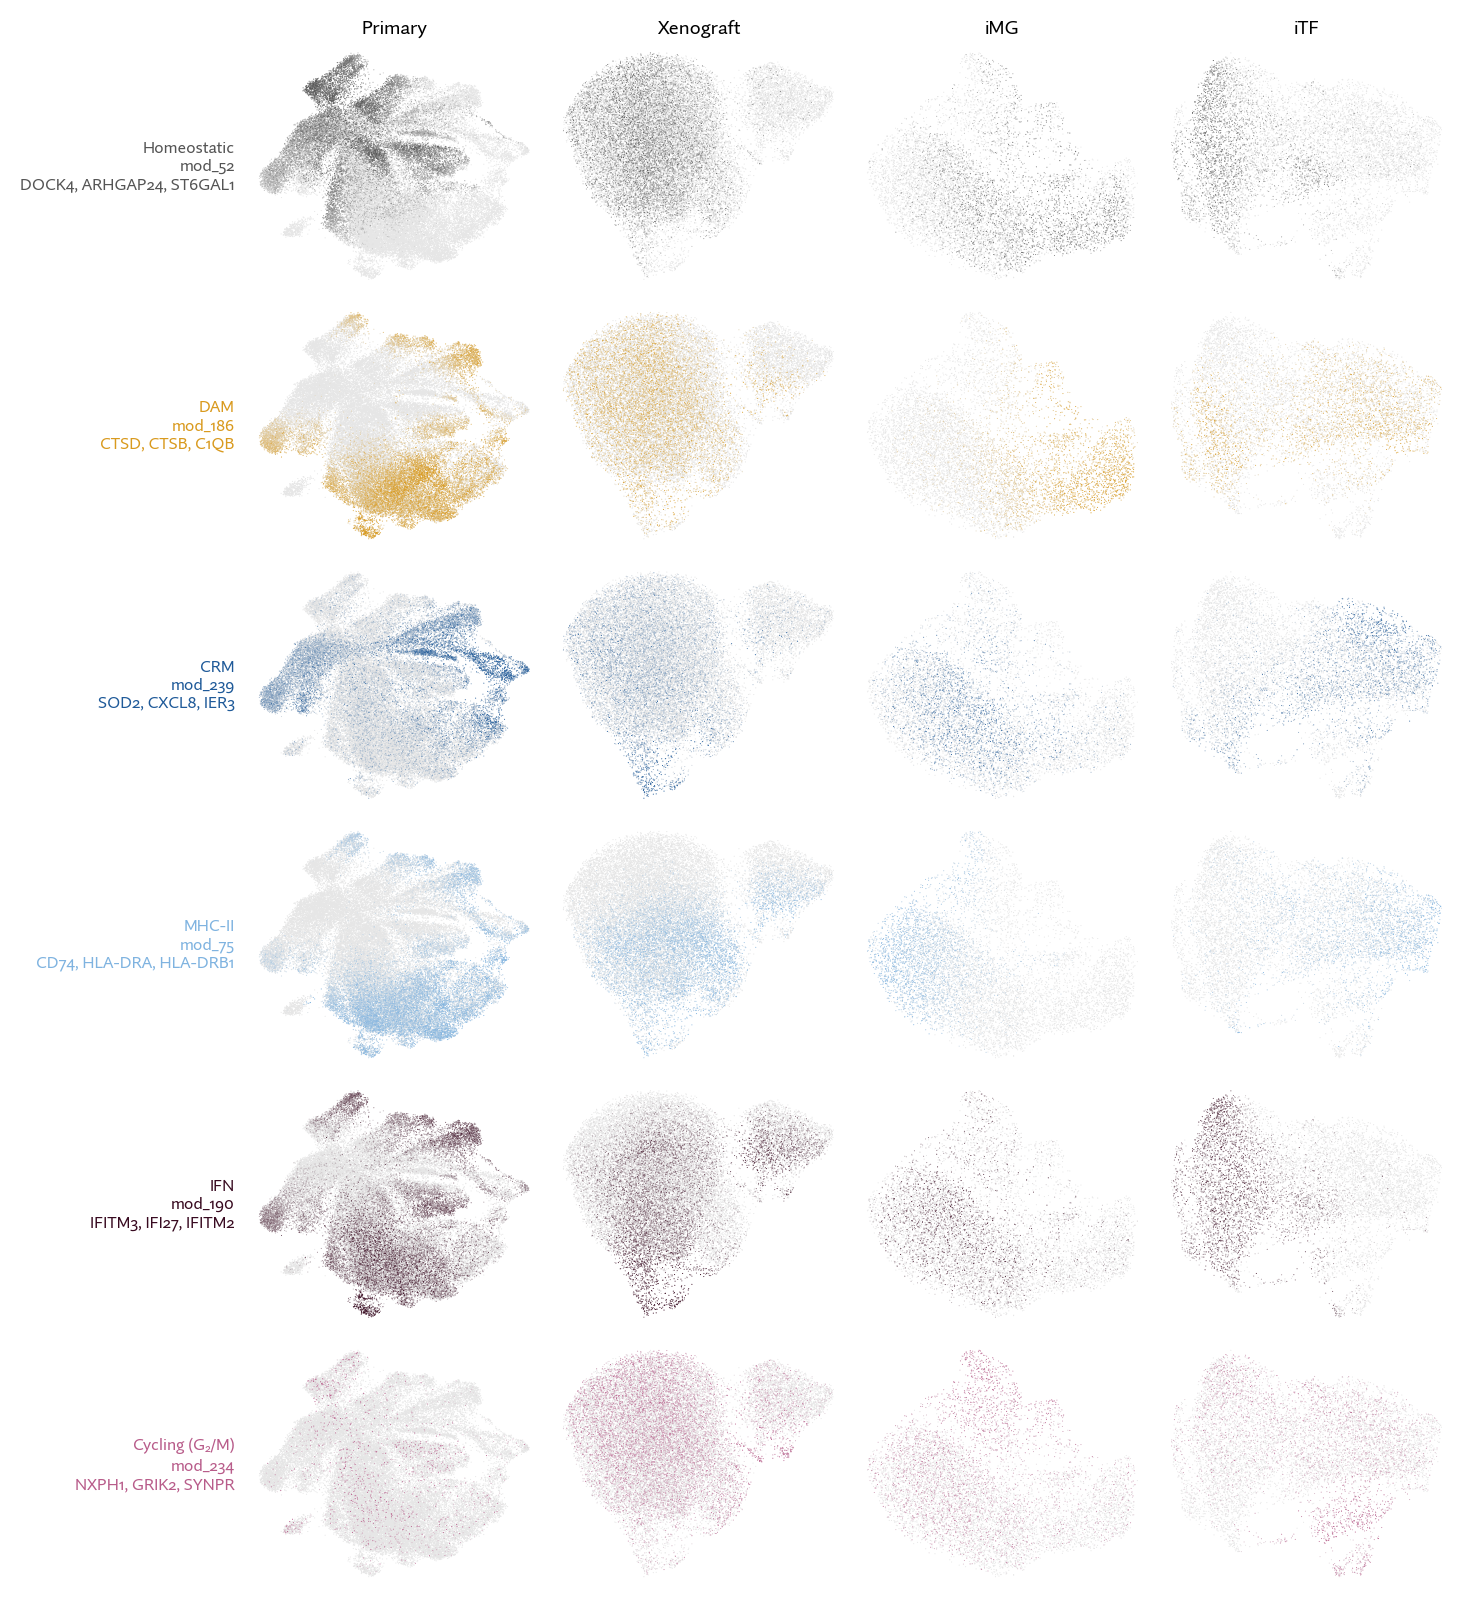
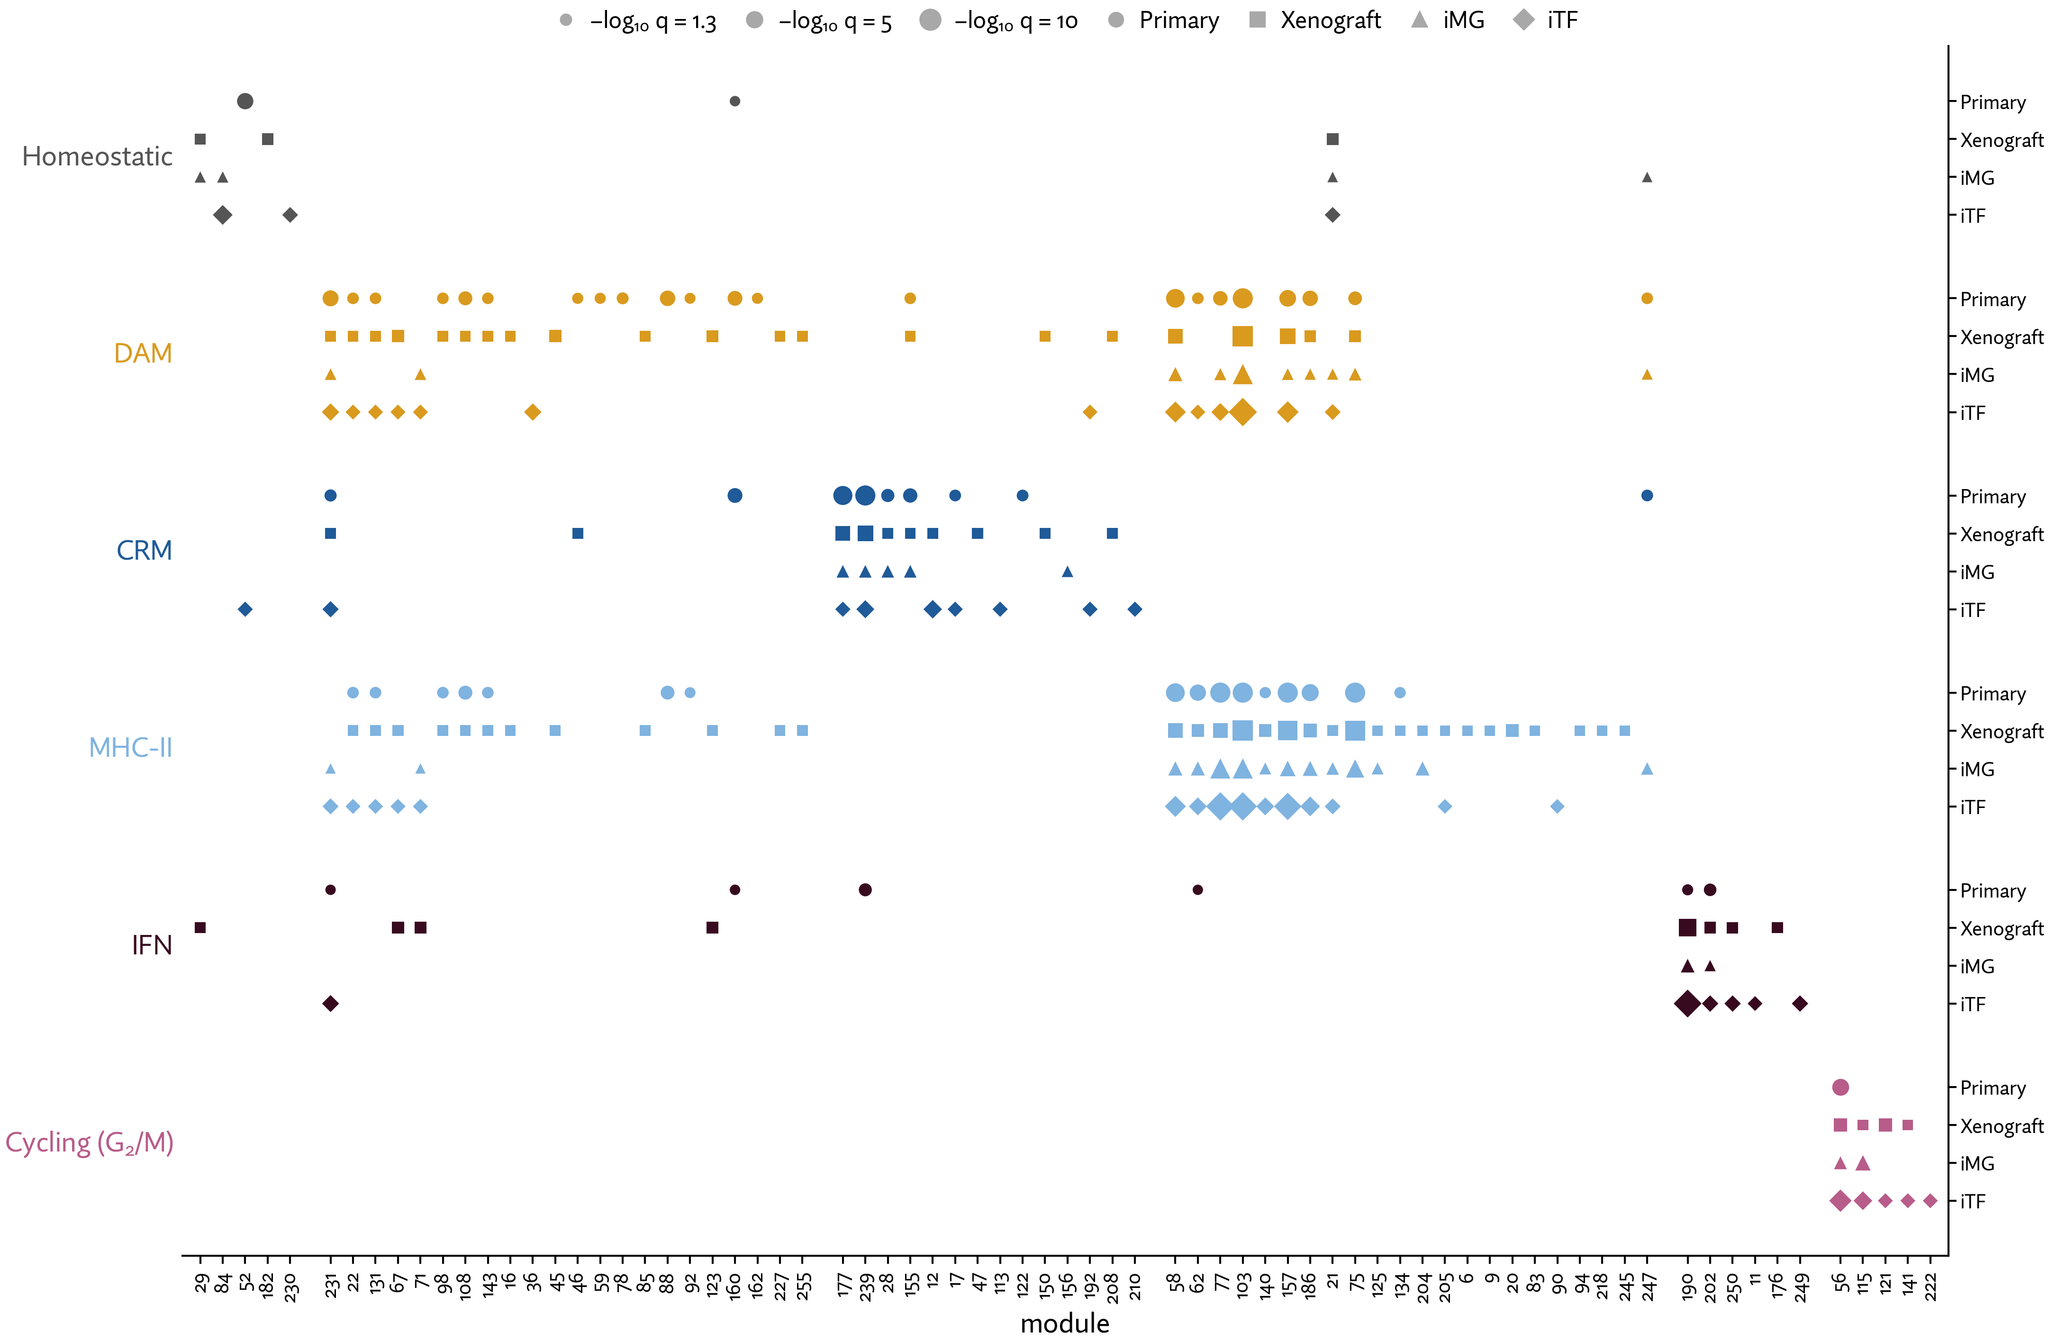
Figure 4. a, ICM recovers known microglial state signatures across all four datasets. Over-representation analysis (ORA) identifies modules enriched for six reference microglial state signatures: Homeostatic, DAM, CRM, IFN, and MHC-II from Fumagalli et al.28, and Cycling from Tirosh et al.43. For each module, we test its highest-weighted genes (5–50 genes above the weight-distribution elbow) for signature enrichment using a hypergeometric test with Benjamini–Hochberg correction48 across six signatures per module. Each marker represents a significant enrichment (q < 0.05); marker size reflects −log₁₀ q, and shape identifies the dataset. Interactive UMAPs show the activity of selected modules across cells, including both control and perturbed cells. Activity colors are scaled independently within each dataset and do not indicate absolute activity differences between models.
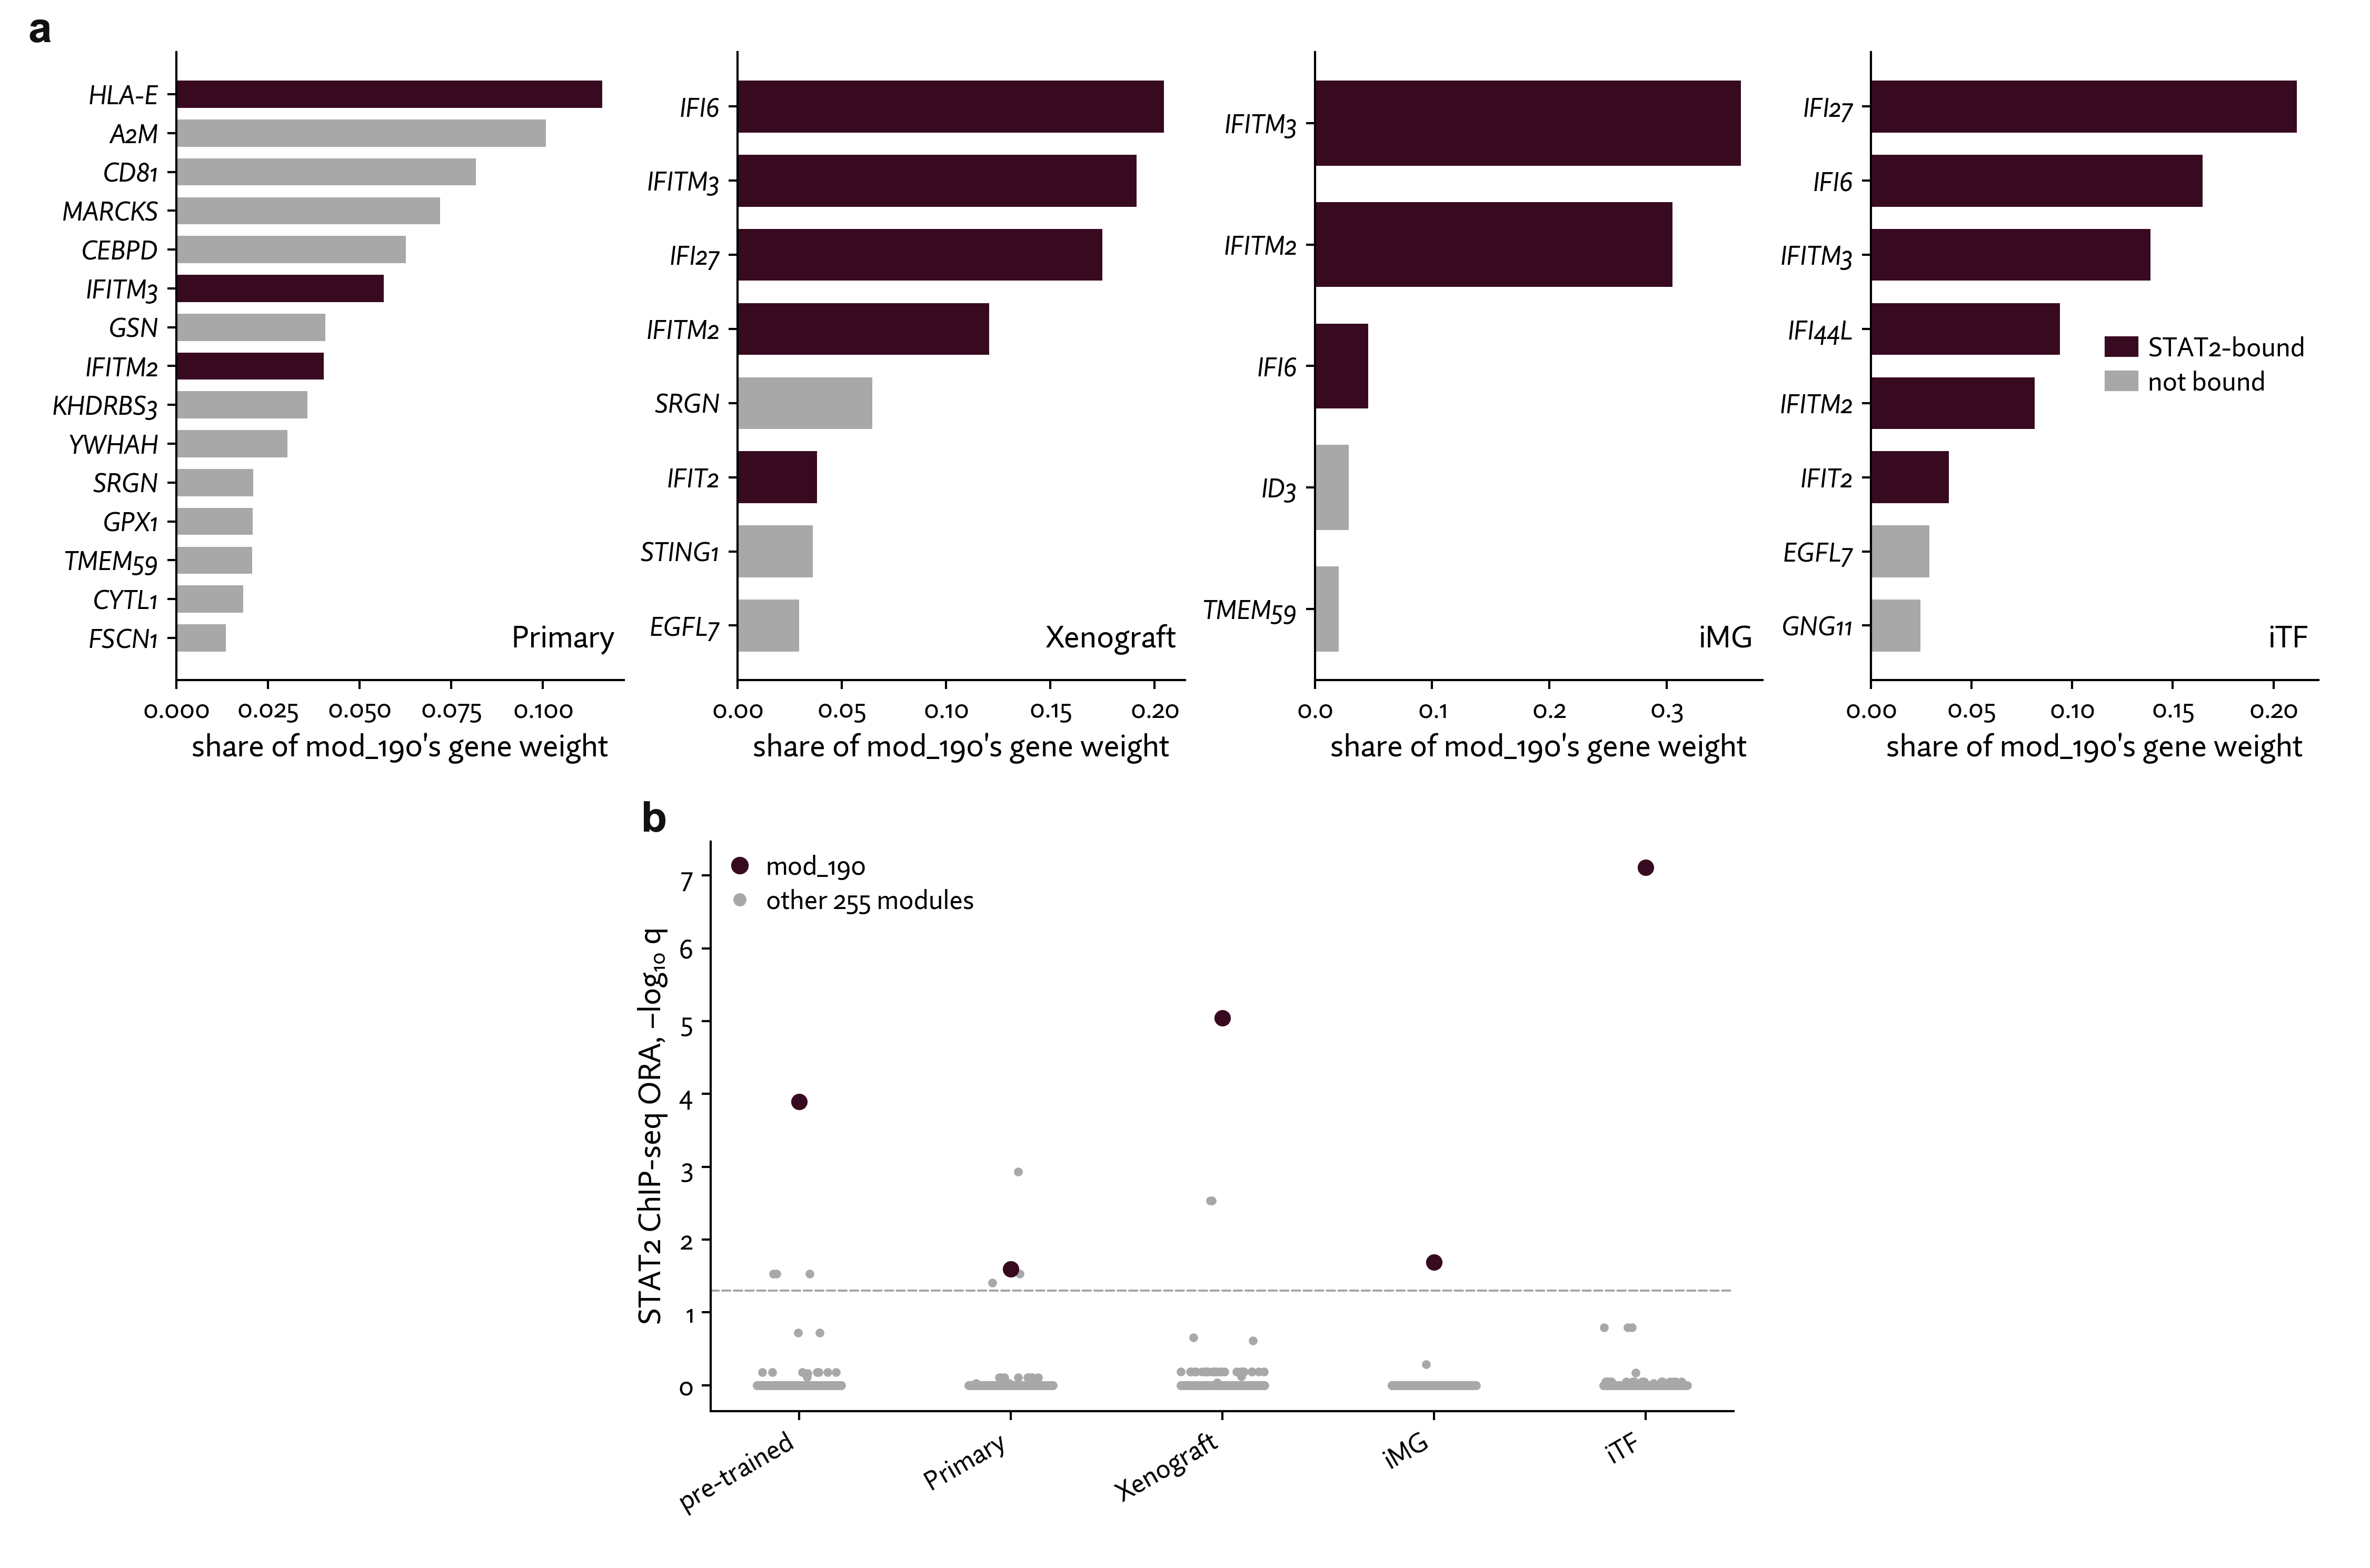
Figure 5. STAT2-bound genes across microglial contexts. a, STAT2-bound genes contribute to mod_190 across microglial contexts. Bars show the fraction of mod_190's total gene weight assigned to each of its highest-weighted genes in Primary, Xenograft, iMG, and iTF. Burgundy indicates genes with STAT2 binding evidence from ENCODE ChIP-seq in K562 cells49; gray indicates genes without such evidence. Gene composition and weight distributions differ between contexts. b, mod_190 is the only module consistently enriched for STAT2-bound genes across the pretrained bank and all four microglial datasets. We tested each module's highest-weighted genes for enrichment of STAT2-bound genes. Points represent individual modules, with mod_190 highlighted in burgundy. Values show −log₁₀ q after Benjamini–Hochberg correction across 256 modules within each bank. The dashed line marks q = 0.05.
Recovering known microglial states shows that ICM captures recognizable cell states, but it does not tell us which regulators might influence these states. We therefore asked whether modules are enriched for genes bound by known transcription factors, which could help link module activity to specific perturbations. As an example, we focus on STAT2, a transcription factor that mediates interferon responses50. mod_190 was the only module significantly enriched for in both the pretrained bank and all four microglial datasets (Figure 5a, b). Together with its association with the interferon-response state, this suggests that mod_190 captures a STAT2-associated biological program and provides a potential link between module activity and perturbation response.
Following an MHC-II module reveals dendritic-cell-like features in in vitro microglia models
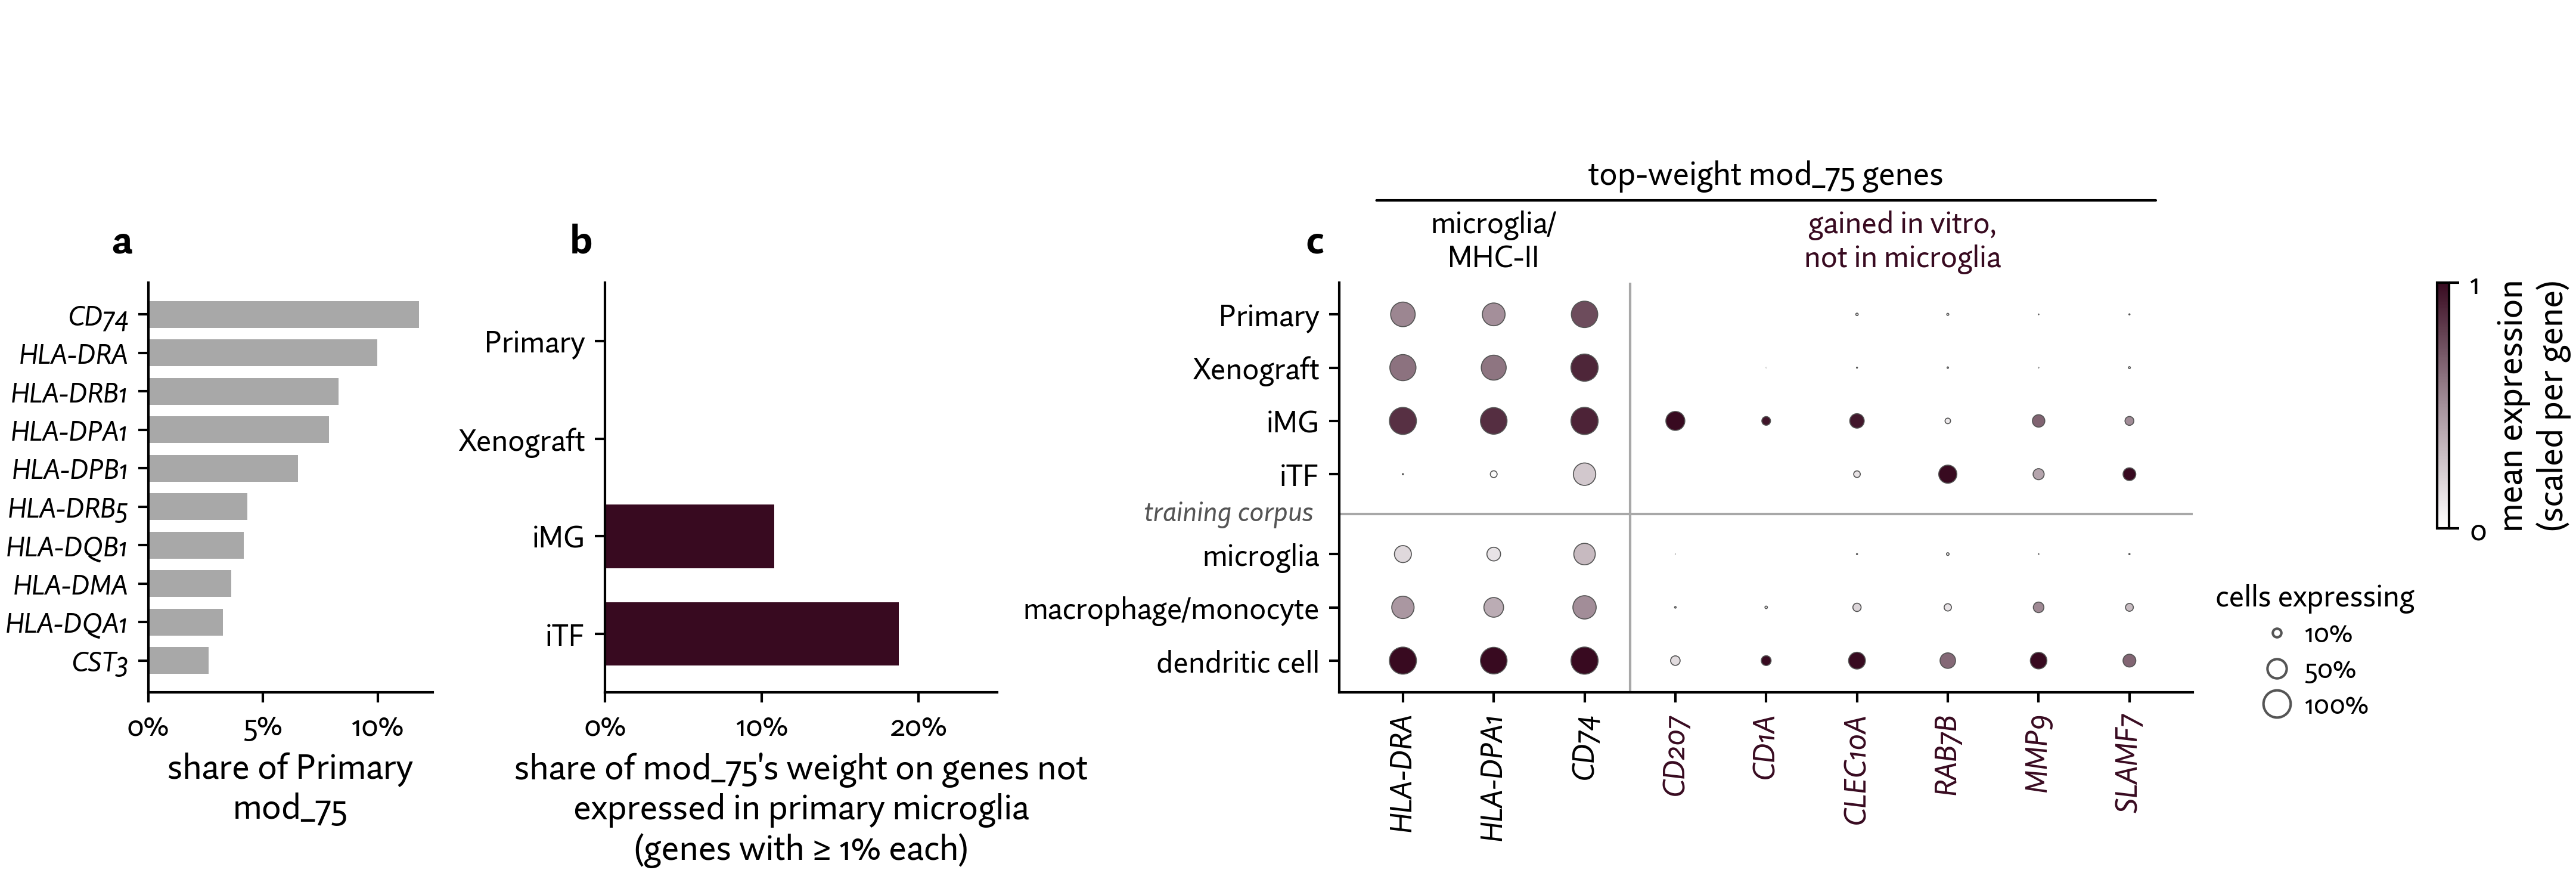
Figure 6. In iMG and iTF, the MHC-II module puts weight on genes that primary microglia do not express. a, The ten highest-weighted genes in mod_75 from primary microglia, showing its association with antigen presentation through HLA class II genes and CD74. Bars indicate each gene's share of total module weight. b, In iMG and iTF, more than 10% of mod_75's weight falls on genes rarely detected in primary microglia. Bars show the fraction of module weight assigned to genes detected in fewer than 1% of primary microglia, counting only genes contributing at least 1% of module weight individually. c, Newly weighted genes in the in vitro models show expression patterns associated with dendritic cells in the pretraining corpus. The dotplot shows expression of selected mod_75 genes across the four microglia datasets and pretraining corpus microglia, macrophages/monocytes, and dendritic cells. iMG and iTF use non-targeting control cells; corpus macrophages/monocytes and dendritic cells come from outside the brain, while corpus microglia are predominantly single nuclei. Color indicates mean log(CP10k + 1), scaled independently to each gene's maximum, and dot size indicates the percentage of cells expressing that gene. These measurements reflect gene expression, not module weights.
Using ICM, we traced a module associated with a known microglial state and uncovered an unexpected resemblance to another cell type.
Identifying known microglial states across datasets can tell us which biological programs ICM captures, but not whether their underlying gene composition differs between models. Because ICM links each adapted module to the same entry in the prior bank, we can examine these differences directly. We demonstrate this with mod_75, a module enriched for the MHC-II state in primary microglia.
In primary microglia, HLA class II genes account for ~53% of mod_75's weight, consistent with an antigen-presentation-associated program (Figure 6a). The xenograft version retains much of this gene composition, whereas in both iMG and iTF, more than 10% of module weight falls on genes with little or no expression in primary microglia (Figure 6b).
The two in vitro models also differ in which additional genes contribute to mod_75. In iMG, mod_75 retains HLA class II genes but also gains CD207, CLEC10A, and CD1A. In iTF, HLA class II genes account for only 9% of the module's weight, while CD74 accounts for 41%, alongside newly weighted genes RAB7B, MMP9, and SLAMF7 (Figure 6c). In the pretraining corpus, these six newly weighted genes are most widely expressed in dendritic cells and are nearly undetected in microglia.
By comparing the same module across contexts, ICM revealed unexpected dendritic-cell-like features without requiring us to search for dendritic-cell markers in advance. This finding raises a testable question: do these features reflect contaminating cell populations or differentiation-associated changes within microglia-like cells? More broadly, this example demonstrates how ICM can uncover biological differences between experimental models that known state annotations alone might miss.
Modules reveal why a STAT2 knockdown has different effects across in vitro models
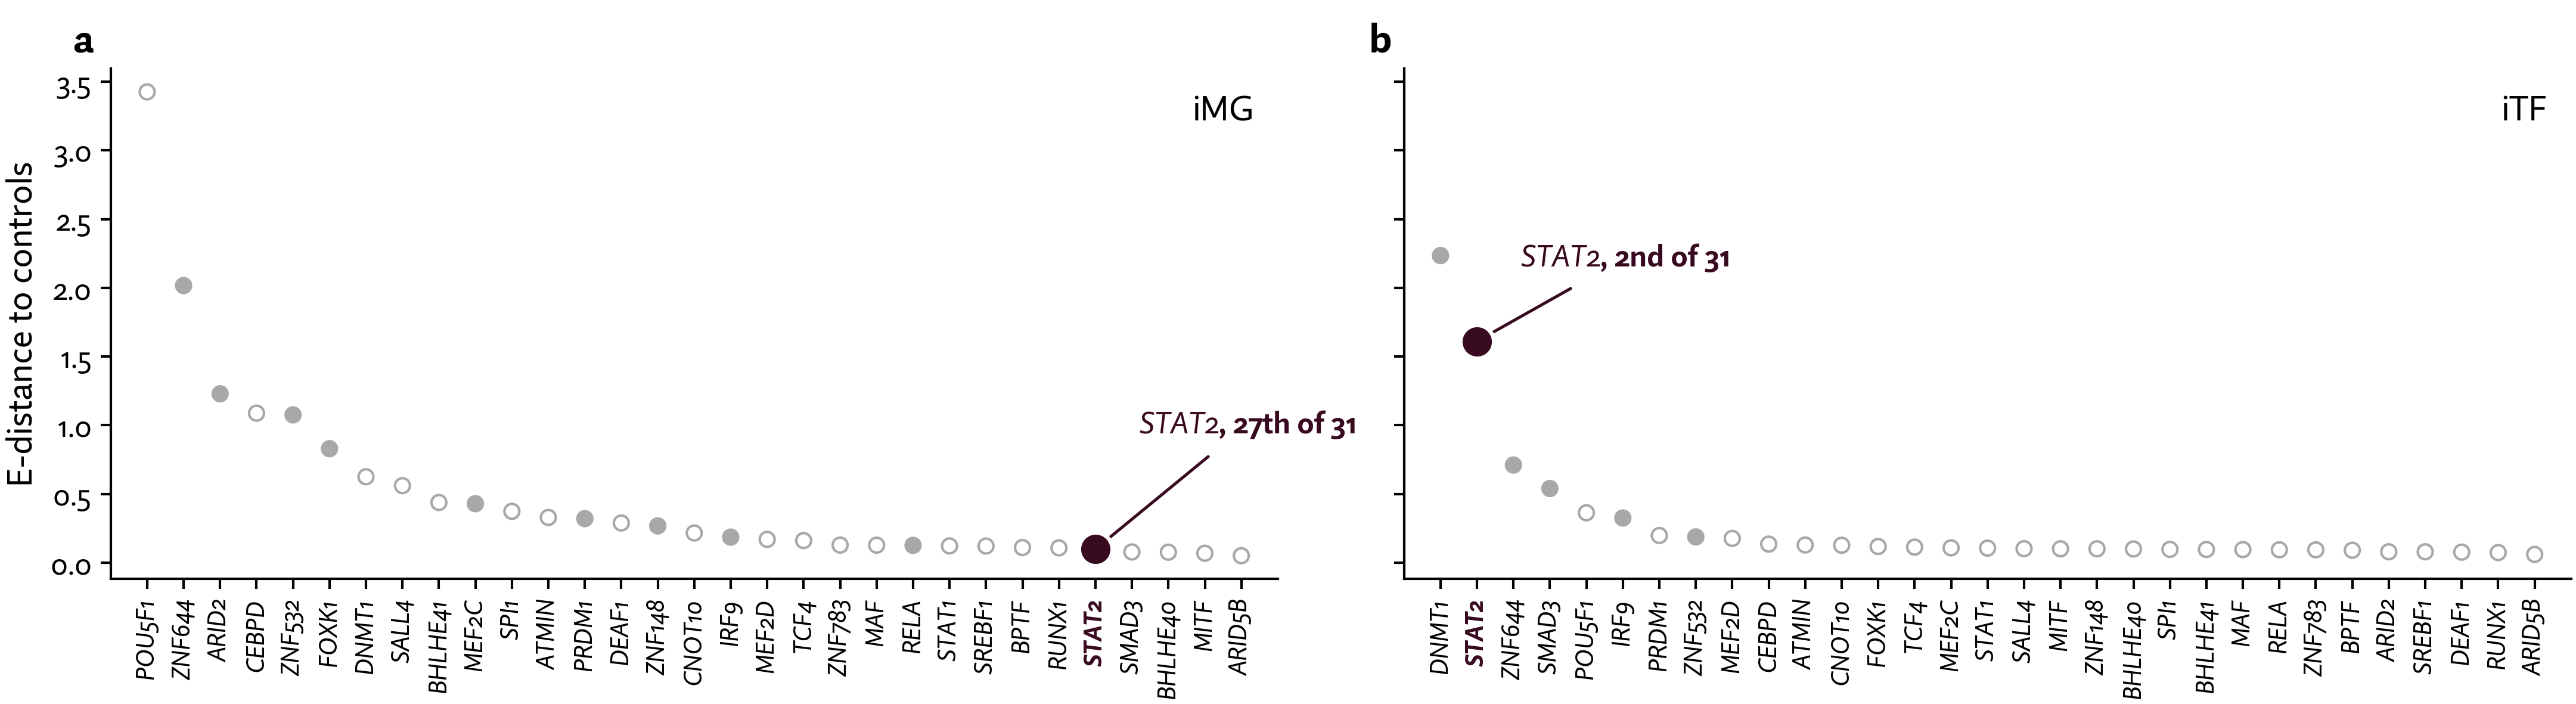
Figure 7. STAT2 knockdown produces a much larger transcriptomic response in iTF than iMG. Each point represents one of 31 gene knockdowns, ranked by E-distance from non-targeting controls within each model, calculated using pertpy's V-statistic51,52,53. E-distance measures differences between the transcriptomic distributions of knockdown and control cells. STAT2 (burgundy) ranks second in iTF and 27th in iMG using this estimator. V-statistic rankings are sensitive to small perturbation-group sizes, but the substantially larger STAT2 response in iTF remains robust to using the unbiased estimator. Filled points indicate significant E-test results (1,000 label permutations; Holm–Šídák correction).
In the introduction, we posited that gene modules are a useful resolution for studying perturbations. Here, we test that idea on a concrete observation: the same perturbation has a very different effect in different in vitro models. Understanding these differences points to a practical application: Modules can guide the choice of in vitro model to use for a perturbation screen before that screen is run.
McQuade et al.42 performed the same 31-gene CRISPRi screen in iMG and iTF, including knockdown of STAT2, a key regulator of interferon signaling. Yet STAT2 knockdown produced strikingly different responses: it ranked among the strongest perturbations in iTF by E-distance, but only 27th of 31 in iMG, where its effect was much smaller (Figure 7).
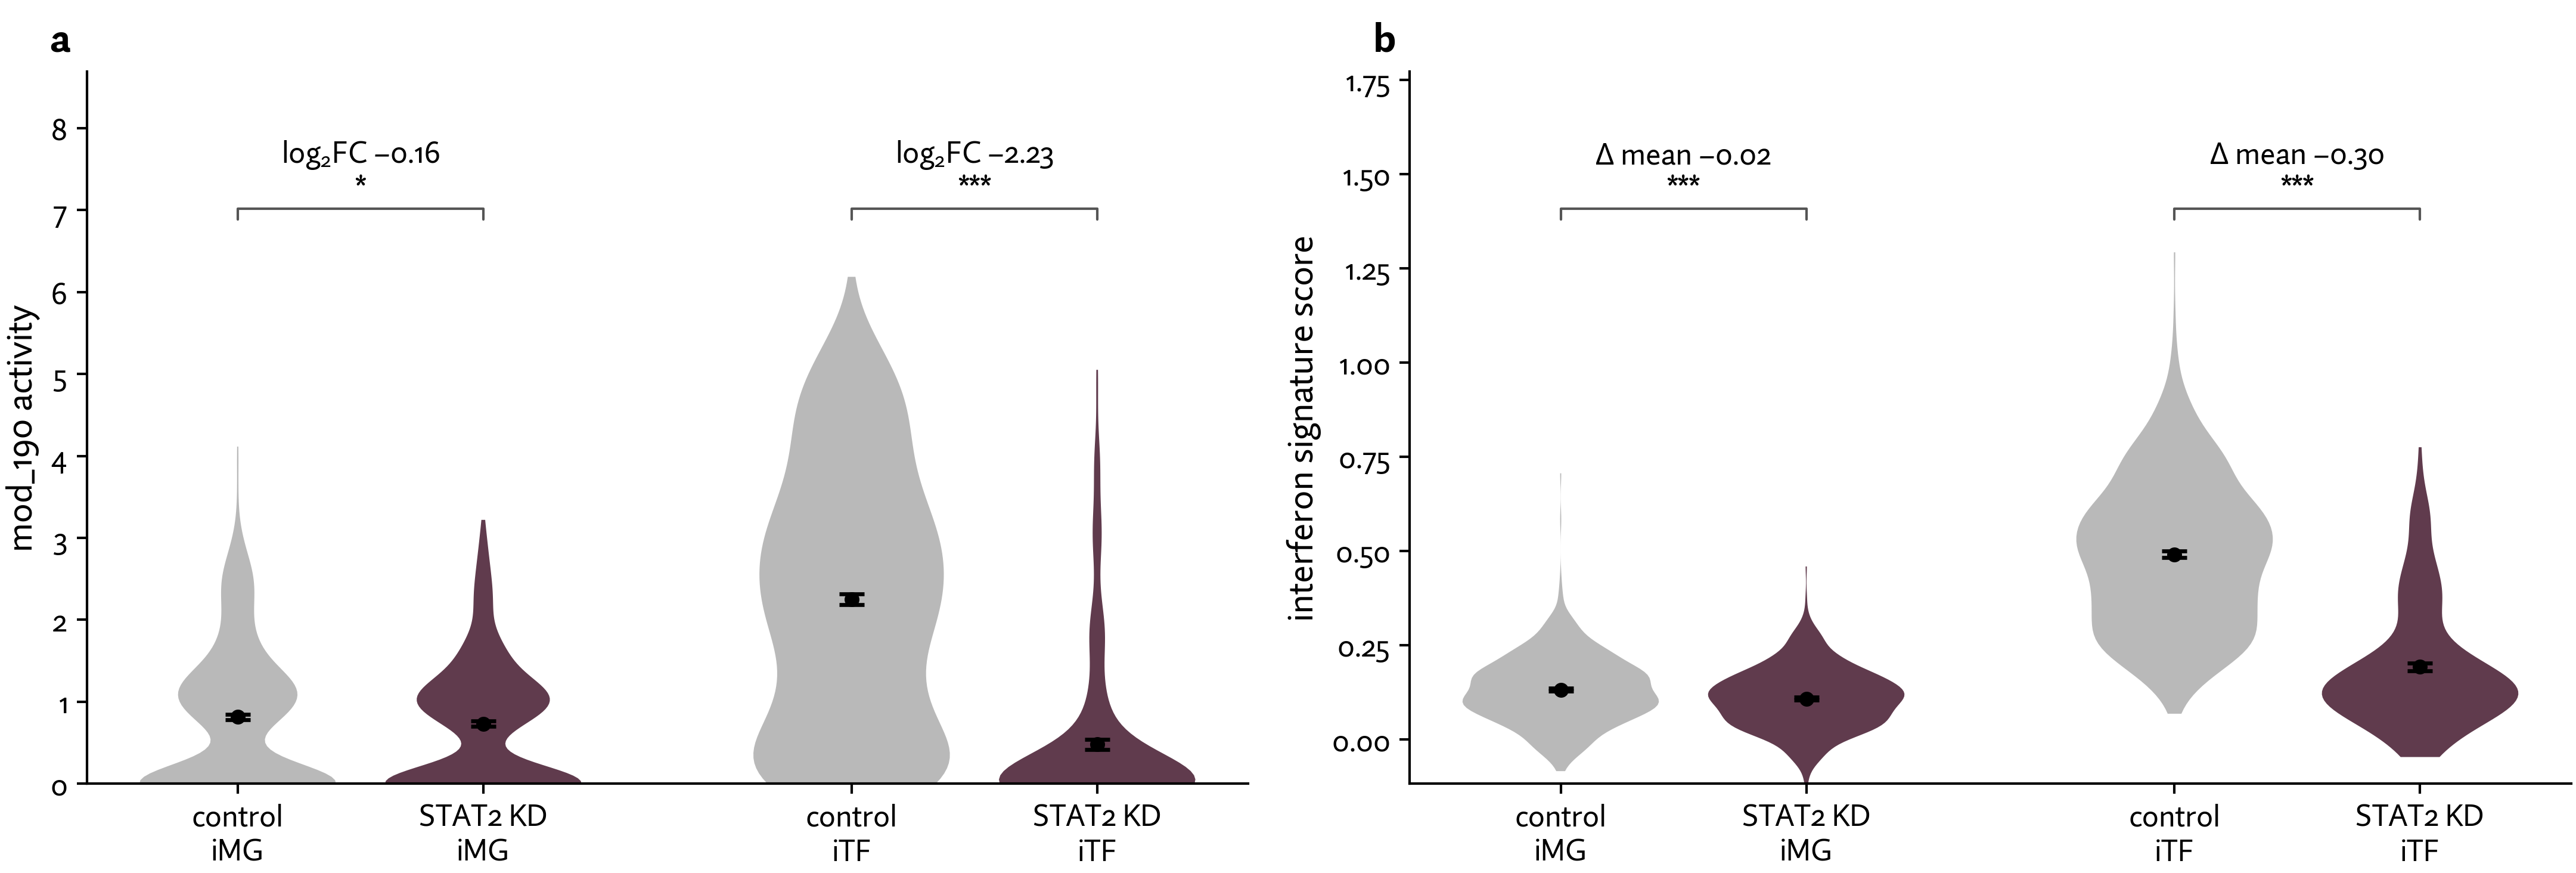
Figure 8. STAT2 knockdown reduces interferon-associated activity much more strongly in iTF than iMG. a, In iTF, mod_190 has higher baseline activity and decreases sharply after STAT2 knockdown (log₂ fold change −2.23), whereas iMG starts with lower activity and shows a much smaller decrease (−0.16). Module activities are inferred using each model's context-adapted version of mod_190. b, An independent interferon-response signature shows the same pattern, with a larger decrease in iTF (difference of means −0.30) than in iMG (−0.02). Signature scores use Scanpy's54 score_genes on 68 Fumagalli interferon genes28 detected in at least 1% of cells in both models. Gray indicates non-targeting controls and burgundy indicates STAT2 knockdown (iMG: 661 control and 566 knockdown cells; iTF: 577 and 268). Black points and bars show mean ± s.e.m. Annotations report log₂ fold change of means (a) or difference of means (b); significance was assessed using two-sided Wilcoxon rank-sum tests (* P < 0.05; *** P < 0.001). Module activities are in model-specific units; comparisons of activity changes are within each in vitro model.
As described above, mod_190 is highly enriched for STAT2-bound genes in every dataset (Figure 5a, b), so we would expect STAT2 knockdown to lower its activity. In iTF, we see high mod_190 activity at baseline, and STAT2 knockdown removes almost all of the activity (log2 fold change −2.23; Fig. 8a). In iMG, baseline activity is already low and changes little after knockdown (−0.16). The independent interferon-response state signature shows the same pattern (−0.30 versus −0.02; Fig. 8b). These results suggest that differences in baseline biological activity help explain why the same perturbation has such different effects across models.
We chose STAT2 as a positive control because the interferon response is well characterized, allowed us to evaluate our findings against known biology. However, the broader opportunity is to use this approach when we know less about a target or how it will behave in different experimental models. For an understudied target, we would not know in advance which module matters or which in vitro model to screen in.
Here, we propose a few guiding questions using ICM and public data to prospectively select in vitro models before committing to a costly perturbation screen:
- Which biological programs might the perturbation affect? We can identify modules associated with a target using independent evidence, such as STAT2 ChIP-seq data linking STAT2 to mod_190.
- Are the relevant biological programs active in the model? Baseline module activities can help us assess whether a model captures the processes we intend to perturb. For example, iTF has substantially higher baseline activity of the STAT2-associated interferon program than iMG.
- What cell states are we interested in moving between to alter the disease we’re studying? Are both cell states robustly present in the in vitro model at baseline? (e.g. the interferon microglia state activity is strong in iTF, but not in iMG).
Together, these analyses show how comparable and interpretable modules can help us assess the biological suitability of an in vitro model for a particular perturbation. Using public resources and baseline expression data, we could identify potential mismatches between models and experimental goals before committing to costly perturbation screens.”
Discussion
A central challenge in perturbation modeling is that the same perturbation can produce different effects across cell types, in vitro models, and cell states. ICM makes that context inspectable by learning comparable and interpretable gene modules from a broad pretraining corpus and adapting them to the biological patterns present in each dataset.
Our microglia case study demonstrates why both properties are useful. ICM recovered known microglial states and identified a STAT2-associated interferon module across experimental contexts. Comparing module composition revealed unexpected dendritic-cell-like features in in vitro microglia, while comparing baseline module activity helped explain why STAT2 knockdown produced a strong response in iTF but little response in iMG.
Together, these findings suggest a way to evaluate in vitro models based on the biological processes relevant to a particular experiment, rather than their overall resemblance to primary tissue alone. By combining module composition and baseline activity with existing regulatory evidence, ICM helps researchers select experimental models before running perturbation screens and interpreting their results afterward.
An important next step is to test whether ICM can prospectively identify suitable models and anticipate perturbation responses across a wider range of targets and cellular contexts. To extend this work, we are currently running large scale experiments using in vitro models composed of complex tri-cultures of microglia, neurons, and astrocytes. These experiments span hundreds of millions of cells across different genetic and disease backgrounds. Fortunately, the scale of these projects allows for staged readouts, allowing us to plan future combinatorial perturbations by interrogating contexts from a prior stage — a perfect fit for ICM. Ultimately, we see learned, adaptable, and interpretable modules as fundamental architectural building blocks for the next generation of virtual cell models.
About Parthenon
Parthenon is Prima Mente’s virtual cell platform. Designed to be cell- and indication-agnostic, Parthenon today focusses on the microglia, neuron, and astrocyte. The platform enables our efforts in target biology and mechanism discovery by modeling cellular responses to chemical and genetic perturbations. Parthenon is powered by large scale perturbational data generation efforts.
We apply a first-principles approach to modeling the underlying mechanisms of biology. If you find this type of analysis interesting, please sign up for the Alzheimer’s Translation Challenge!
Author contributions
Y.S., A.P., K.B., and J.H. conceived of and designed the study, trained and evaluated models, analyzed results, and drafted the manuscript. F.M.M.-Z. and K.B. prepared the data corpus. A.P., Y.S., and P.N. contributed to machine learning engineering and infrastructure. P.N. and R.S. managed the project. All authors contributed to the interpretation of the results and critically reviewed and revised the manuscript.
Acknowledgements
We thank Pooja Kathail, Andrey Karailiev, Rachel (Qiurui) Zeng, and Alfred Wong for their kind feedback on the text. We thank Sam Gubbins and Shabbir Khan for enabling this work through infrastructure. We are grateful to Hannah Madan for their mentorship and support, as well as to the rest of the Prima Mente team for their continued support. We thank the Nebius and Nvidia teams for their ongoing support, infrastructure, and compute for model training and inference. Parthenon was originally catalysed by the Alzheimer’s Insights AI Prize, backed by the Alzheimer’s Disease Data Initiative.
Citation
@misc{primamente2026icm,
  title        = {Redefining cell states with In-Context Module discovery},
  author       = {Shirsath, Yash and Patel, Anooj and Blake, Kerrigan and
                   Hoover, Jonathan and Martin Zamora, Francisco Manuel and
                   Niki, Pouya and Solanki, Ravi},
  year         = {2026},
  month        = {Nov},
  url          = {https://www.primamente.com/blog/icm/},
  organization = {Prima Mente}
}
Download the citation: BibTeX (.bib) RIS (.ris) EndNote (.enw) CSL-JSON (.json)
References
1. Tian, R. et al. CRISPR interference-based platform for multimodal genetic screens in human iPSC-derived neurons. Neuron 104, 239–255 (2019).
2. Dräger, N. M. et al. A CRISPRi/a platform in human iPSC-derived microglia uncovers regulators of disease states. Nat. Neurosci. 25, 1149–1162 (2022).
3. Gosselin, D. et al. An environment-dependent transcriptional network specifies human microglia identity. Science 356, eaal3222 (2017).
4. Bohlen, C. J. et al. Diverse requirements for microglial survival, specification, and function revealed by defined-medium cultures. Neuron 94, 759–773 (2017).
5. Stark, R., Grzelak, M. & Hadfield, J. RNA sequencing: the teenage years. Nat. Rev. Genet. 20, 631–656 (2019).
6. Hicks, S. C., Townes, F. W., Teng, M. & Irizarry, R. A. Missing data and technical variability in single-cell RNA-sequencing experiments. Biostatistics 19, 562–578 (2018).
7. Lähnemann, D. et al. Eleven grand challenges in single-cell data science. Genome Biol. 21, 31 (2020).
8. Langfelder, P. & Horvath, S. WGCNA: an R package for weighted correlation network analysis. BMC Bioinformatics 9, 559 (2008).
9. Kotliar, D. et al. Identifying gene expression programs of cell-type identity and cellular activity with single-cell RNA-Seq. eLife 8, e43803 (2019).
10. Lee, D. D. & Seung, H. S. Learning the parts of objects by non-negative matrix factorization. Nature 401, 788–791 (1999).
11. Locatello, F. et al. Object-centric learning with slot attention. Adv. Neural Inf. Process. Syst. 33, 11525–11538 (2020).
12. Sharma, G. et al. projectR: an R/Bioconductor package for transfer learning via PCA, NMF, correlation and clustering. Bioinformatics 36, 3592–3593 (2020).
13. Kotliar, D. et al. Reproducible single-cell annotation of programs underlying T cell subsets, activation states and functions. Nat. Methods 22, 1964–1980 (2025).
14. Welch, J. D. et al. Single-cell multi-omic integration compares and contrasts features of brain cell identity. Cell 177, 1873–1887 (2019).
15. Kunes, R. Z. et al. Supervised discovery of interpretable gene programs from single-cell data. Nat. Biotechnol. 42, 1084–1095 (2024).
16. Lotfollahi, M. et al. Biologically informed deep learning to query gene programs in single-cell atlases. Nat. Cell Biol. 25, 337–350 (2023).
17. Dong, M. et al. Stack: in-context learning of single-cell biology. Preprint at bioRxiv https://doi.org/10.64898/2026.01.09.698608 (2026).
18. Buettner, F., Pratanwanich, N., McCarthy, D. J., Marioni, J. C. & Stegle, O. f-scLVM: scalable and versatile factor analysis for single-cell RNA-seq. Genome Biol. 18, 212 (2017).
19. Aibar, S. et al. SCENIC: single-cell regulatory network inference and clustering. Nat. Methods 14, 1083–1086 (2017).
20. Gavish, A. et al. Hallmarks of transcriptional intratumour heterogeneity across a thousand tumours. Nature 618, 598–606 (2023).
21. Pedrocchi, F., Barkmann, F., Joudaki, A. & Boeva, V. Sparse autoencoders reveal interpretable features in single-cell foundation models. Preprint at bioRxiv https://doi.org/10.1101/2025.10.22.681631 (2025).
22. Schubert, M. et al. Perturbation-response genes reveal signaling footprints in cancer gene expression. Nat. Commun. 9, 20 (2018).
23. Taroni, J. N. et al. MultiPLIER: a transfer learning framework for transcriptomics reveals systemic features of rare disease. Cell Syst. 8, 380–394 (2019).
24. Meng, L. et al. BioMod: biological module tokenization for single-cell foundation modeling. Preprint at bioRxiv https://doi.org/10.64898/2026.10.12.758490 (2026).
25. Argelaguet, R. et al. MOFA+: a statistical framework for comprehensive integration of multi-modal single-cell data. Genome Biol. 21, 111 (2020).
26. Morabito, S., Reese, F., Rahimzadeh, N., Miyoshi, E. & Swarup, V. hdWGCNA identifies co-expression networks in high-dimensional transcriptomics data. Cell Rep. Methods 3, 100498 (2023).
27. Martins, A. F. T. & Astudillo, R. F. From softmax to sparsemax: a sparse model of attention and multi-label classification. Proc. Mach. Learn. Res. 48, 1614–1623 (2016).
28. Fumagalli, L. et al. Microglia heterogeneity, modeling and cell-state annotation in development and neurodegeneration. Nat. Neurosci. 28, 1381–1392 (2025).
29. Tuddenham, J. F. et al. A cross-disease resource of living human microglia identifies disease-enriched subsets and tool compounds recapitulating microglial states. Nat. Neurosci. 27, 2521–2537 (2024).
30. Gerrits, E. et al. Distinct amyloid-β and tau-associated microglia profiles in Alzheimer’s disease. Acta Neuropathol. 141, 681–696 (2021).
31. Prinz, M., Jung, S. & Priller, J. Microglia biology: one century of evolving concepts. Cell 179, 292–311 (2019).
32. Hickman, S., Izzy, S., Sen, P., Morsett, L. & El Khoury, J. Microglia in neurodegeneration. Nat. Neurosci. 21, 1359–1369 (2018).
33. Salter, M. W. & Stevens, B. Microglia emerge as central players in brain disease. Nat. Med. 23, 1018–1027 (2017).
34. Hansen, D. V., Hanson, J. E. & Sheng, M. Microglia in Alzheimer's disease. J. Cell Biol. 217, 459–472 (2018).
35. Bellenguez, C. et al. New insights into the genetic etiology of Alzheimer's disease and related dementias. Nat. Genet. 54, 412–436 (2022).
36. Nott, A. et al. Brain cell type–specific enhancer–promoter interactome maps and disease-risk association. Science 366, 1134–1139 (2019).
37. Guerreiro, R. et al. TREM2 variants in Alzheimer's disease. N. Engl. J. Med. 368, 117–127 (2013).
38. Hamelin, L. et al. Early and protective microglial activation in Alzheimer's disease: a prospective study using ¹⁸F-DPA-714 PET imaging. Brain 139, 1252–1264 (2016).
39. Suárez-Calvet, M. et al. Early changes in CSF sTREM2 in dominantly inherited Alzheimer's disease occur after amyloid deposition and neuronal injury. Sci. Transl. Med. 8, 369ra178 (2016).
40. Keren-Shaul, H. et al. A unique microglia type associated with restricting development of Alzheimer's disease. Cell 169, 1276–1290 (2017).
41. Olah, M. et al. Single cell RNA sequencing of human microglia uncovers a subset associated with Alzheimer's disease. Nat. Commun. 11, 6129 (2020).
42. McQuade, A. et al. Transcriptional regulation of disease-relevant microglial activation programs. Neuron https://doi.org/10.1016/j.neuron.2026.07.001 (2026).
43. Tirosh, I. et al. Dissecting the multicellular ecosystem of metastatic melanoma by single-cell RNA-seq. Science 352, 189–196 (2016).
44. Hasselmann, J. et al. Development of a chimeric model to study and manipulate human microglia in vivo. Neuron 103, 1016–1033 (2019).
45. McQuade, A. et al. Development and validation of a simplified method to generate human microglia from pluripotent stem cells. Mol. Neurodegener. 13, 67 (2018).
46. Khatri, P., Sirota, M. & Butte, A. J. Ten years of pathway analysis: current approaches and outstanding challenges. PLoS Comput. Biol. 8, e1002375 (2012).
47. Boyle, E. I. et al. GO::TermFinder—open source software for accessing Gene Ontology information and finding significantly enriched Gene Ontology terms associated with a list of genes. Bioinformatics 20, 3710–3715 (2004).
48. Benjamini, Y. & Hochberg, Y. Controlling the false discovery rate: a practical and powerful approach to multiple testing. J. R. Stat. Soc. B 57, 289–300 (1995).
49. ENCODE Project Consortium. An integrated encyclopedia of DNA elements in the human genome. Nature 489, 57–74 (2012).
50. Schneider, W. M., Chevillotte, M. D. & Rice, C. M. Interferon-stimulated genes: a complex web of host defenses. Annu. Rev. Immunol. 32, 513–545 (2014).
51. Peidli, S. et al. scPerturb: harmonized single-cell perturbation data. Nat. Methods 21, 531–540 (2024).
52. Székely, G. J. & Rizzo, M. L. Energy statistics: a class of statistics based on distances. J. Stat. Plan. Inference 143, 1249–1272 (2013).
53. Heumos, L. et al. Pertpy: an end-to-end framework for perturbation analysis. Nat. Methods 23, 350–359 (2026). https://doi.org/10.1038/s41592-025-02909-7
54. Wolf, F. A., Angerer, P. & Theis, F. J. SCANPY: large-scale single-cell gene expression data analysis. Genome Biol. 19, 15 (2018).